More and more investors are using the power of computing
technologies and quantitative techniques to manage their portfolios
these days. They believe that quantitative trading can help reduce the
PnL volatility resulted from emotional decision making and thus increase
the consistency of returns. However, sometimes the machine beats the
man, and sometimes it does not. Recently, quantitative funds seemed to
suffer considerable losses after British Prime Minister Theresa May
shocked markets by calling a snap election.
Among the most high-profile losers was Connecticut-based
investment firm AQR Capital Management’s $13.3 billion computer-driven
Managed Futures Strategy, which lost 1.1 percent on Tuesday, according
to an investor who was told by the hedge fund, representing a loss of
more than $130 million. The same strategy made 5.2 percent on the day
the results of Britain’s EU referendum were revealed in June. Two other hedge funds run by machines, which the investor declined to name, lost 2.8 percent and 1.9 percent. Read more
As pointed out by Maiya Keidan et al, the strategies that lost money were mostly trend-following in nature.
Trend following is a very popular strategy. Another, lesser-known
type of quantitative trading, which we write extensively about in our blog,
takes place in the volatility space. Specifically, volatility traders
and hedgers bet on the future volatility dynamics or distribution of
returns. They can do so by using mathematical models to predict the
implied and/or realized volatilities. One of the most popular volatility
prediction methods is the GARCH
model. However, there exist other lesser-known quantitative methods,
such as factor model that can be used to predict the volatility and help
with decision making. As reported by Andrea Wong, such a factor model
is being used by a hedge fund.
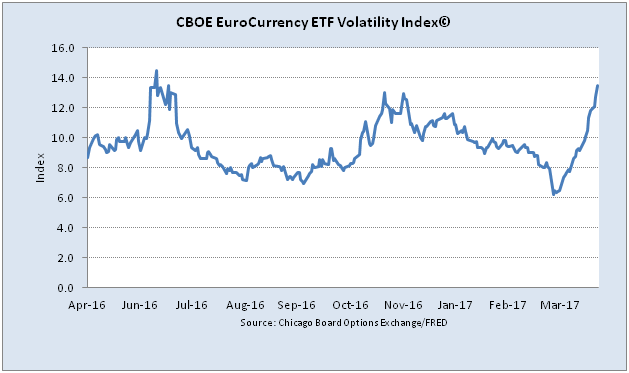
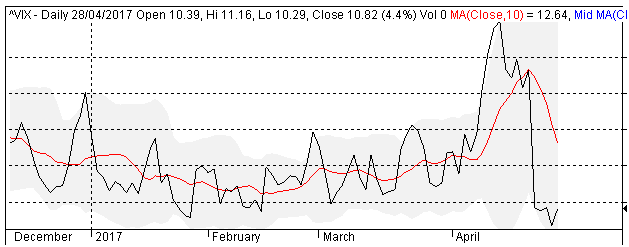
VIX as of Apr 28, 2017. Source: Yahoo financeThere are a number of reasons to heed the signals from Noorani
and his team: their model, which analyzes around 30 macroeconomic
factors from rate differentials to China’s credit default swaps,
explains 91 percent of the movement in dollar-yen over a rolling
four-month period. It sent out warning signals in mid-February before
the dollar peaked. The framework was developed by Michael Hobson, a
professor of astrophysics at the University of Cambridge. Read more
While quantitative trading is believed to be beneficial to many
market participants, some observers and regulators are worried about its
negative impact on the market, especially during a downturn. Recently
Keith Savard wrote:
The risk of turmoil is even greater given that markets already
are trying to absorb a technological revolution that includes enhanced
algorithmic trading, the proliferation of electronic bond trading
platforms and increased reliance on exchange-traded funds (ETFs).Read more
So is the jury still out whether we should embrace quantitative trading or not?
Today Rupert Hargreaves wrote that in fact many Japanese insurers are following the same strategy
According to Bank of America’s findings, the investment plans
remain largely unchanged from last year. Domestic yields are too low for
buying Japanese Government Bonds, so life insurers are having to look
overseas to acquire the yield they require.
“Insurers plan to increase their overall holdings of foreign
bonds, much as they did in the previous term, but the weighting they
give to each geographic region will greatly depend on the US rate hike
environment, European political risk, and FX trends.”
However, the big change this time around is that these companies
are planning to buy foreign bonds ex-currency hedging, which may have
major implications for US corporate bonds. Read more
Not hedging requires that you have an accurate view of the market
directions. Even if you do, it’s still beneficial to hedge. For
example, with the expectation of rising interest rates, corporate
treasurers and Chief Financial Officers started thinking about how to
hedge the interest rate risks. Recently, Ajoy Bose-Mallick et al
presented a good article on fixed income hedging. They argued that
hedging is beneficial to both sellers and buyers:
Hedging the interest rate can protect both the lender and the
borrower as it brings certainty to the interest rate costs and hence the
available cash flows from the investment. This certainty means the
borrower has one thing less to worry about on their investment. Below we
highlight the key issues that should be considered
The authors also provided some examples of hedging strategies:
Type of hedge: Interest Rate Swap, Cap, and Collar are the main
hedging instruments. The choice of hedge instruments should be aligned
to the underlying business, and prevailing market conditions. An
Interest Rate Swap fixes the interest costs and has the advantage of
known costs, however it is not flexible if the loan is to be repaid
prematurely. Fixing the interest rate also has the disadvantage of high
opportunity cost in the case where interest rates remain low or become
even lower. The Cap is an insurance-like instrument and protects the
borrowers from interest rates going above a chosen level and lets
borrowers take advantage of prevailing lower rates in case rates do not
increase. The Cap can also be unwound at no further costs in case the
borrower decides to pay the loan prematurely. However, a premium is
required to be paid for a Cap hedge. The Collar hedge is a hybrid
between an Interest Rate Swap and a Cap hedge and fixes the interest
rate costs between chosen boundaries for zero or small up-front cost. No
complicated or exotic hedges, such as callable hedges, should be
considered and hedging notionals or tenors should not exceed the
underlying loan notionals or tenor. Read more
Another, simpler, hedging technique that uses Forward Rate Agreement is presented by Sunil K Parameswaran:
Uncertainty regarding future rates of interest is a matter of
concern to both potential borrowers as well as lenders. The former would
be worried about the spectre of rising rates, while the latter would be
concerned with the possibility of a rate decline. Consequently, both
kinds of traders may wish to hedge the risk regarding future rates of
interest. One such hedging tool is a forward rate agreement (FRA).
By using such a derivative one can lock in a rate of interest for
a transaction scheduled for a future date. Forward rate agreements are
cash settled. That is, on a specified future date the profit for one
party, or equivalently, the loss for the other party would be computed. Read more
No matter what hedging strategy, simple or complex, we are using, we
should have a good understanding of the hedging instruments, market
environments, various regulatory and operational requirements.
One of the examples was Mitsui Life, a Japanese insurer who bought
foreign bonds and then proceeded to hedge the currency risks. However,
as Tomo Uetake reported yesterday, another Japanese insurer thinks that
FX hedging is too expensive and decided not to hedge:
Japan’s biggest private life insurer Nippon Life Insurance Co
[NPNLI.UL] plans to boost foreign bond holdings without currency hedging
in an effort to counter low domestic interest rates, senior company
officials said on Wednesday.
Japanese insurers have been shifting into foreign assets in
search of higher yields, but the biggest challenge has been how to
secure sufficient returns after hedging against currency swings. “When appropriate, we plan to buy foreign bonds without currency
hedging this fiscal year (to March 2018), as we expect the dollar to
strengthen gradually,” Naoki Akiyama, general manager for Nipon Life’s
investment planning, told reporters. Read more
On the other hand, as pointed out by Adriana Barrera et al., Mexican
state-owned oil company Pemex still thinks that hedging to ensure price
stability is important:
Mexican state-owned oil company Pemex will consider repeating a
recently instituted hedging program in future years, as it looks to firm
up its balance sheet and avoid the need for surprise budget cuts, a top
executive said late on Tuesday.
Petroleos Mexicanos [PEMX.UL], as the company is officially
known, reported on Tuesday that it has hedged its output through
December, the first time it has done so in 11 years, as an insurance
policy against volatile oil prices.
The oil hedging program, which will run from May to December and
guarantees a price of $42 per barrel for up to 409,000 barrels per day,
will cost the company $133.5 million. Read more
Yesterday, Tom Lee pointed out some diverging signs in the stock market:
First, Lee is concerned that the long-term yield curve has
narrowed substantially. A flattening yield curve is a widely viewed
marker of slowing economic growth, as this suggests the expected return
of long-term spending then has smaller expected return on investment.
The spread between the 30-year Treasury yields and the 10-year Treasury
yields, as Lee observed, has flattened since just after the U.S.
election in November “and historically signals market weakness ahead.”
“In the past, the bond market has been much better at ferreting
out problems and smelling slowdowns; that’s the message from the yield
curve. So I think the bond market is really taking the position that
growth is going to disappoint, and the gap between the hard data and the
soft data is still pretty big,” Lee said Monday.
10 year Treasury June future. Source: Interactivebrokers
Next, he outlined that the credit spreads of high-yield debts started widening
Specifically, Lee notes that since 1998, the market has seen 30
instances in which high-yield spreads widened 60 basis points, as it did
in late March, and the market saw a decline in 93 percent of instances
(falling by a median 4 percent). The thinking is that high-yield
indicates a tightening of financial conditions. Read more
On the same topic, Sid Verma reported on Bloomberg that there are disparities between the stock and bond markets.
In the green corner are stocks. The Standard & Poor’s 500
index is just 0.2 percent away from a record high reached in March on
bets that Donald Trump’s administration will push through tax-code
changes to spark growth. In the red corner sit U.S. government bonds,
where benchmark 10-year Treasury yields have unwound almost half of
their post-election increase, suggesting a far more pessimistic view the
economy.
“The increasing divergence between global equity market
performance and bond markets has raised questions as to whom is right,”
Jefferies Group LLC analysts led by Sean Darby wrote in a note. Read more
How long will these divergences last and what would be the final outcome?
This is the question that everybody wants an answer.
This week, Rebecca Ungarino of CNBC pointed out that the problem is
not only in the loan defaults, but also in the decline of used-car
prices:
Used-car prices are sliding, and some warn that this trend could
have sharply negative effects on both relevant stocks and on the economy
as a whole. “This is a credit bubble in autos that is very reminiscent of the
subprime mortgage crisis,” Larry McDonald, head of global macro
strategy at ACG Analytics, said Friday in an interview on CNBC’s
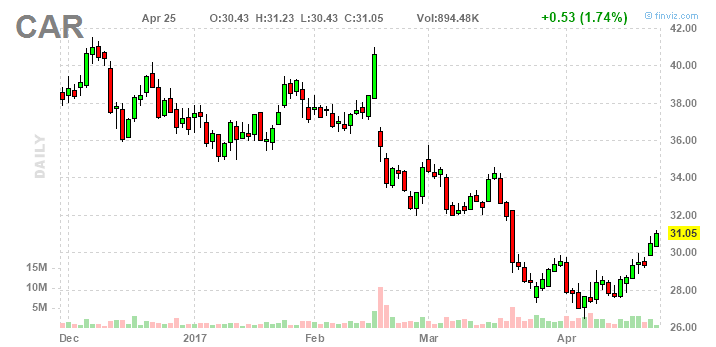
And the decline in the used-car prices is already reflected in the credit default swaps of auto rental companies
Avis stock price. Source: Finviz.com Bets on the failure of Hertz and Avis to repay their bonds, as
measured by five-year credit default swaps, are on the rise as used-car
prices fall and auto loan delinquencies edge higher. Elsewhere in the
industry, automakers General Motors and Fiat Chrysler this month
reported March sales figures that missed expectations; Read more
However, some experts argued that the market capitalization of the
auto industry is too small to have a significant impact on the economy.
We will see what happens next. In the meantime, and as always, risk
management is key.
Two weeks ago, in a post entitled To Hedge or Not to Hedge,
we argued that it’s always important for corporations to hedge the
commodity prices and not to speculate. This post continues with more
examples that highlight the importance of economic hedging.
As oil price fluctuates, airlines can see their revenue vary widely.
They can reduce the revenue volatility by hedging the fuel costs
Globally, risk managers quote Southwest Airlines’ long running
(25 years) and successful corporate hedging programme, which makes up
one-third of their costs. Ryan Air remains one of the latest examples of
having hedged their exposures to the extent of 95% in 2017, having
declared price certainty as their target than low prices. Singapore
Airlines Ltd, remains another south-east Asian airline that has
currently reported to have extended its hedging horizon from the
previous 2-5 years hedging an average of 37% of its total fuel cost.
Meanwhile, Malaysian Airlines has taken a prudent approach in the
current oil price environment and has aggressively hedged 65% of their
fuel oil requirements for 2017 at about a bit north of $60/bbl. While
hedging is catching up as a healthy practice to protect the bottom lines
among airline firms globally it is yet to catch up in World’s ninth
largest civil aviation market—India, where the cost of fuel for an
airline fluctuates widely from 28% to 63% of its total operating
expense. Read more
Recently, the French election has caused some uncertainties in the
market as it was reflected in the term structure of volatility. As
reported by Laura Dew, some portfolio managers did not leave it to
chance and hedged their portfolios:
The latest hedge against potential turmoil in Europe employed by
TwentyFour is via an option position on a weaker euro versus the US
dollar. With the euro/dollar back up close to $1.08, rather than $1.05
where it has recently been, even a more market friendly French election
outcome may not cost money if the US dollar finds some of its prior
inertia. There is no such thing as a free option, but we think this is a
cheap way of protecting some downside exposure to an event that may not
be as clear cut as the polls suggest. Read more
As the results of increasing political risks in Europe, the corporate
credit spreads started widening. Japanese investors took this
opportunity to buy European bonds as an alternative to low-yielding
domestic bonds. However, they have to hedge the currency risks, as
pointed out by Hideyuki Sano:
Because they do not like exposure to foreign exchange
fluctuations, they use currency hedging on a large part of their foreign
bond investment. The hedging costs are closely tied to short-term interest rate
gaps between currencies and rises in dollar interest rates mean hedging
will become costlier for Japanese investors. On the other hand, because the euro zone’s short-term interest
rates are deep into negative territory, hedging for the euro costs
almost nothing, or sometimes even produces extra returns. Read more
The above examples provided insights into large corporation hedging programs and clearly demonstrated the importance of hedging.
This week, Rupert Hargreaves of Valuewalk pointed out that the
defaults in the auto sector started to spread out to other areas of the
market:
“Will rising consumer default rates spread from autos to other
loans? Yes. We are already seeing evidence that subprime personal
unsecured and credit card delinquency rates are rising from low levels
in recent vintages, and bank loan officer surveys validate this thesis.
Further, poor performance in auto loans is increasingly emerging not
only in subprime but also non-prime (and some prime) loans.” Read more
Likewise, on the corporate credit market side, Bob Stokes recently
wrote that European credit spreads are widening, meaning that investors
have become more fearful:
Many European bond investors are not so confident about the future. Yield spreads between investment grade bonds and lower quality
debt has been widening. This means investors in the shakier debt
perceive a greater risk of defaults, so they’re demanding a higher yield
for assuming that risk.
The bond market is behaving much as it did before previous credit
crises in 2008, 2010 and 2012. … On February 7, French 10-year notes
sank to an 18-month low, sending French spreads over German debt (top
chart) to their widest level since early 2014. Dutch and Italian spreads
(middle and lower chart) have likewise widened, recently touching
respective three-year highs. Read more
However, despite these warning signs, the equity volatility still remains relatively low. In fact, Nicholas Spiro wrote
The ability of markets to climb a “wall of worry” and turn a
blind eye to the plethora of vulnerabilities facing the global economy –
from the rapid build-up of corporate debt in China to the dangers in
exiting ultra-loose monetary policies, particularly in Europe and Japan –
seems to know no bounds. This makes it nigh impossible for economists
and investment strategists to predict with any degree of certainty the
catalysts and precise timing of the next major financial crisis
He also pointed out a reason for the subdued volatility
International investors – initially speculative ones such as
hedge funds, but more recently long-term institutional investors – have
been placing big bets on volatility remaining subdued for the
foreseeable future. These bets, known as “shorting”, or selling,
volatility in Wall Street parlance, have proven extremely profitable and
are suppressing volatility further.
Yet the more subdued the volatility, the greater the distortion
in asset prices and, once financial turmoil finally erupts, the bigger
the scope for a much more disorderly sell-off than would otherwise be
the case if investors had not been selling volatility over the past
several years.
What is clear is that the Vix has become a poor gauge of
investors’ sensitivity to the vulnerabilities and threats in the global
economy that could precipitate the next crisis. Read more
As of the close of today, the VIX index seems to be going down again.
With a decreasing VIX, investors might start thinking about selling
volatility. In fact, a post by Ellen Chang today discussed selling naked
puts. The post started with favoring put selling, but it then pointed
out some risks involved in shorting volatility:
While there is a limited upside, sellers of options should be
cautioned that there is a greater downside loss because you could lose
than more than 100% of your original capital invested. Writing options to generate higher returns comes with a large
amount of risk and “collecting an immediate payoff is not as easy as it
sounds Options writers are often compared to the house of a casino,” Ma
said. “It only makes sense if you have the large cashflow to pay out in
the short run. Remember, in the long run, the house always wins. Shorting the indexes is one strategy to profit from increased
volatility, but most investors are not comfortable doing because of the
increase in risk, said Meredith Zidek, a Hunt Valley, Md.-based options
and ETF trader. Read more
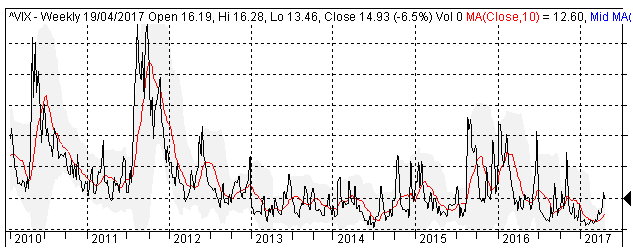
The chart below shows the VIX index from 2010 to the present.
As we can observe from the chart, the VIX has exhibited several sharp
spikes following relatively quiet periods. This means that selling
naked puts and not managing them correctly is indeed a risky business.
On the research side, a recent paper entitled Forecasting a Volatility Tsunami
by A. Thrasher presented several studies on the volatility spikes. It
also provides a method for predicting those spikes. Although we still
haven’t had any opinion yet on the merits of this prediction method, we
think the paper is worth a read
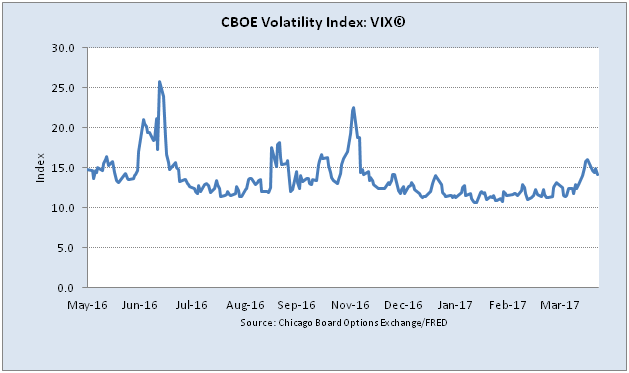
The empirical aim of this paper is motivated by the anecdotal
belief among the professional and non-professional investment community,
that a “low” reading in the CBOE Volatility Index (VIX) or large
decline alone are ample reasons to believe that volatility will spike in
the near future. While the Volatility Index can be a useful tool for
investors and traders, it is often misinterpreted and poorly used. This
paper will demonstrate that the dispersion of the Volatility Index acts
as a better predictor of its future VIX spikes.
In a previous post,
we examined the relationship between the Credit Default Swap (CDS) and
equity volatility, and argued that there is a strong correlation between
them. But like any relationship in financial markets, this one can
break down and divergence can happen.
For instance, last month we noticed that CDS in Asia and Australia
tightened considerably with respect to their US counterparts. Bloomberg
actually reported:
Credit-default swaps on the bonds of every Asian emerging market
except for South Korea have tumbled this year, outperforming debt risk
for the U.K. and for France, which has jumped amid the presidential
election campaign. Inflows into developing Asian bond markets have also
swelled in 2017 as investors bet the world’s fastest-growing region will
be able to better withstand the volatility and outflows unleashed by a
tightening Federal Reserve.
“Emerging Asia scores relatively well on both macro as well as
political stability and is likely to remain an attractive region to
invest in for the foreseeable future,” said Anders Faergemann, a senior
fund manager in London at PineBridge, which manages about $83 billion
globally. “The short-term risk is mainly associated with external
factors as the markets fear the Fed is behind the curve.” Read more
This tightening of CDS in Asia presented an interesting trade opportunity. Indeed, Asia Unhedged pointed out:
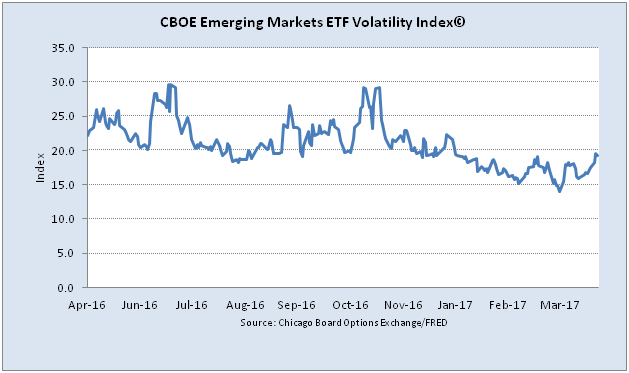
The difference between emerging market (EM) and US corporate BBB
Option-Adjusted Spread is at an all-time low. The difference between EM
volatility and VIX is around the average. This chart begs the question:
Is there a trade in shorting credit and buying equity? Read more
This means that the EM CDS is relatively low with respect to the US
counterpart when taking the volatility differential into account. The
post also suggested going long EM equity and short its CDS.
So this is an example of divergence. But it’s important to note that it happens between the VIX and CDS differentials, i.e. it represents a dislocation between secondary risks, and not primary risks.
A convertible bond (or preferred share) is a hybrid security, part
debt and part equity. Its valuation is derived from both the level of
interest rates and the price of the underlying equity. Several modeling
approaches are available to value these complex hybrid securities such
as Binomial Tree, Partial Differential Equation and Monte Carlo
simulation. One of the earliest approaches was the Binomial Tree model
originally developed by Goldman Sachs [1,2] and this model allows for an
efficient implementation with high accuracy. The Binomial Tree model is
flexible enough to support the implementation of bespoke exotic
features such as redemption and conversion by the issuer, lockout
periods, conversion and retraction by the share owner etc.
In this post, we will summarize the key steps in valuing a
convertible bond using the Binomial Tree approach. Detailed description
of the method and examples are provided in references [1,2].
Generally, the value of a convertible bond with embedded features depends on:
The underlying common stock price
Volatility of the common stock
Dividend yield on the common stock
The risk free interest rate
The credit worthiness of the preferred share issuer
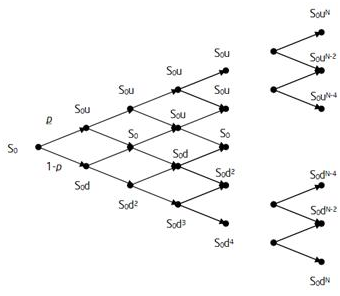
Within the binomial tree framework, the common stock price at each node is described as
where S0 is the stock price at the valuation date; u and d are the up and down jump magnitudes. The superscript j refers to the time step and i to the jump. The up and down moves are calculated as
and
where is the stock volatility, and is the time step.
The risk neutral probability of the up move, u, is
and the probability the down move is 1-p
After building a binomial tree for the common stock price, the
convertible bond price is then determined by starting at the end of the
stock price tree where the payoff is known with certainty and going
backward until the time zero (valuation date). At each node, Pj,i the value of the convertible is
where m denotes the conversion ratio.
If the bond is callable, the payoff at each node is
The payoff of a putable bond is
Here C and P are the call and put values respectively; r denotes the risk-free rate.
The above equations are the key algorithms in the binomial tree
approach. However, there are several considerations that should be
addressed due to the complexities of the derivative features
Credit spreads (credit risk) of the issuers which usually are not constant.
Interest rates can be stochastic.
Discount rate ri,j depends on the conversion probability at
each node. This is due to the fact that when the common share price is
well below the strike, the preferred share behaves like a corporate bond
and hence we need to discount with a risky curve. If the share is well
above the strike then the preferred behaves like a common stock and the
riskless curve need to be used.
The notice period: the issuer tends to call the bond if the stock
price is far enough above the conversion price such that a move below it
is unlikely during the notice period. For most accurate results, the
valuation would require a call adjustment factor. This factor is
empirical and its value could be determined by calibration to stock
historical data.
This pricing approach can be implemented in scripting languages such
as VBA and Matlab. In the next installment, we will provide a concrete
example of pricing a convertible bond. If you have a convertible bond
that you want us to use as example, send it to us.
The week ended with high implied volatilities across the board. Eric Lam et al. at Bloomberg wrote:
The calm in stocks worldwide is giving way to concern, with
investors in Europe and the U.S. rushing to hedge against declines and a
Credit Suisse Group AG index flashing a warning as the list of economic
and political obstacles grows.
There’s no shortage of potential concerns. Tensions over North
Korea’s nuclear program have intensified days after the U.S. fired
missiles at a Syrian airfield. There’s uncertainty over the outcome of
the French election, with the first round scheduled for April 23, and in
Britain doubts are emerging on whether the economy can withstand the
political shocks the Brexit negotiations will bring. Read more
So it seems that investors are very concerned with the uncertainties these days.
Interestingly, just about 10 days ago, Joe Mallen et al. of Helios
Quantitative Research presented an interesting chart that showed a
divergence between the index of economic policy uncertainty and the VIX.
The authors then concluded that most investors have become desensitized
to the news headlines:
It seems most investors over the years have simply become
desensitized to the volume of squawking news headlines. In more recent
days, despite economic policy stories that usually cause market
trepidation – such as healthcare reform (or lack thereof), the debt
ceiling debate, and short term interest rate hikes to name a few – the
US equity market has trended to very low levels of volatility. So, why
do some investors say this environment feels so volatile, but
traditional measures of volatility remain historically low? Read more
So currently are investors oversensitive?
After the French election, will we be back to the low volatility environment again?
we discussed how it’s important to hedge against a market downturn, and pointed out some strategies for doing it.
Yesterday, Brian Chappatta reported that some big portfolio managers already started buying volatility
Some of the world’s biggest bond managers have been waiting for
this moment. Rather than ponder the sustainability of the reflation
trade and its implication for yields, investors including Rick Rieder at
BlackRock Inc. and Bob Michele at J.P. Morgan Asset Management say
they’ve been betting that price swings will grow more dramatic in the
days and months ahead. That’s already borne fruit this week, with the
CBOE/CBOT index of 10-year Treasury note volatility, known by its ticker
TYVIX, jumping to the highest closing level since February. Read more
On the research side, Chrilly Donninger timely published a paper on how to protect a portfolio from a tail risk event:
Protecting an equity market portfolio with VIX-Futures eats not
only the kurtosis but also the profits of the portfolio. Being
constantly VIX-Futures long is too expensive Therefore one has to find
an appropriate timing strategy. This working paper presents a
Hidden-Markov-Model which not only has a reasonable
tail-risk-protection but even improves the overall return of the SPY.
The strategy is – at least in the historic simulation – close to what
is called in German an “eierlegende Wollmilchsau” (“egg-laying
wool-milk-sow”). Read more
In volatility space, many investors don’t know exactly what they’re betting on. Briefly, with options, they can bet on:
Terminal distribution of returns
Dynamics of the volatility
Today, we noticed an article by Alex on Valuewalk that discussed these 2 types of options trade. It concluded:
The key takeaway here is: Traders who don’t hedge delta rely on the trend of the underlying more than its volatility to profit. Traders who do hedge delta rely on the volatility of the underlying more than its trend.
It usually doesn’t make sense to hedge your delta unless you have
a professional commission structure. This is why so few do it. All
those hedging trades rack up commissions. And the execution of those
hedges requires a lot of screen time or advanced software than can do it
automatically.
So if you’re not delta hedging, a better question to ask yourself before placing an option trade is: Do I believe the underlying will trend or consolidate over the life of the option?
If your answer to that question is “I think the underlying will
trend”, you should buy optionality. The underlying will trend away from
the strike price and you’ll make money on the option you purchased.
If your answer to that question is “I think the underlying will
consolidate”, you should sell optionality. The underlying will stay
close to the strike price and you’ll collect the premium from the option
you sold. Read more
We agree with some points in the article. However, we note that:
-Even if an investor does not rehedge, i.e. he’s betting on the
terminal distribution, the volatility when he enters the trade does
matter. It’s the price that he pays for his option and it determines his
final payout.
-The article did not discuss the long term expectancy of these types
of bet which is important to know when putting on a new trade.
Last week, we noticed that
the volatility
term structure was inverted on a low reading. In fact, Crystal
Kim wrote:
Under
normal circumstances, VIX futures curve upward. It's entirely
logical -- the
longer dated futures trade at a premium to shorter-dated
futures. An inversion,
as seen yesterday, suggests that the market expects more
volatility in the
short-term than the long-term.
The
reason behind the volatility bid: upcoming elections in
France. "The April
VIX futures are bid ahead of the French elections, since they
will settle into
a 30-day VIX that captures both rounds of voting," he says.
"The U.S.
options market is finally starting to care about the French
elections."
The first round is set for April 23. If no one wins the
majority, a run-off
between the top two will take place on May 7. Read more
Vix futures term structure as of Apr 12, 2017. Source: Vixcentral.com
But these daysanomalies are
happening not just in the
volatility space. As
pointed out by
Kathleen Brooks yesterday,
the CDS market
is also acting out of sync.
On
the one hand there is a smell of caution in the air, but on
the other, capital
is not yet moving away from risky assets.
The
US corporate high yield spread should be used to time market
moves rather than
risk sentiment indicators. The US corporate high yield spread
has a significant
negative weekly correlation with the S&P 500 at -60% for
the last two
years. If this correlation is to hold, then we would expect
the S&P 500 to
continue to rally if the US corporate high yield spread
continues to narrow,
and vice versa. Read more
And finally today forex.com
observed a
breakdown in correlations
At
the start of 2017 the correlation between the S&P 500 and
the high yield
corporate spread was -53%. This seems normal as you would
expect these products
to move inversely to each other: as the S&P 500 rises,
high yield debt
falls and vice versa. However at the start of April this
correlation had
reversed to 33%, so now the S&P 500 and the high yield
debt spread move
together a third of the time. This suggests that 33% of the
time when the
S&P 500 falls, so too does the price of credit for high
risk US
corporations. Usually you would expect the opposite to occur.
Read more
Last and not least, these
articles also
gave a warning of an imminent market correction.
Yesterday the Federal Reserve Chair Janet Yellen said at a
University of Michigan event that the Fed planned to raise short-term
interest rates.
“I think we have a healthy economy now … but it’s been a long time coming,” Yellen said. Yellen said the current unemployment rate of 4.5% is “even a
little bit below” what Yellen and her other colleagues at the Fed would
consider “full employment.” She said inflation is “reasonably close” to
the Fed’s stated goal of two percent. Read more
In a previous post,
we argued that rate hikes will increase volatility through hedging of
prepayment options embedded in mortgage-backed securities.
Recently, Mark Robinson presented another argument:
Analysis from SocGen published during the fourth quarter of 2016
points to a 2.6 per cent return on 10-year notes (the equivalent rate
for the UK was 1.7 per cent). This reflects the general view that US
equity valuations are stretched based on underlying earnings. If we
accept that once investments in riskier assets such as equities are
deemed relatively expensive to government-backed debt, then stocks could
be subject to bigger price swings with increased frequency. Read more
This means that when interest rate rises, equities will appear to
be expensive relative to government-backed bonds, hence they will be
susceptible to selling, thus causing an increase in volatility.
Regardless of the argument, with a rising rate, one might think that
it’s risky to invest in fixed-income securities. However, Tim Mullaney
recently reported that:
Gundlach, CEO of DoubleLine Capital, is betting that the best way to play the coming rate hikes is by holding lots of mortgages
But how about prepayment risk?
“Gundlach doesn’t see prepayment risk as particularly high right
now, but if prepayments spike, there’s a risk of losses for the fund.” Read more
Good investment decision sometimes seems counterintuitive. And if
this is true, then prepayment risk will not be a threat to market
volatility. Let’s see how this plays out.
To add to the “against camp”, Zerohedge just published a
post, citing Eric Peters, the CIO of One River Asset Management:
“The people who are
indexing now are the same ones who were selling in 2009,” continued VICE,
agitated. “I just spoke at a conference filled for wealth advisors from all the
major players. They say the same thing - today’s buyers are not long-term
investors.” They’re guys who put $1mm into index ETFs.
“When they lose 6%-7%
and decide to sell, who will be on the other side of those trades?” And the
stocks that will be savaged worst will be the ones that lagged the indexes on
the way up. “It reminds me of 2000, when people piled into the QQQs.”
“I don’t know when the
next major crisis will hit, no one does,” admitted VICE. “But I do know that
even in the next normal correction, the market’s losses will be amplified
enormously by this move away from active management.”
Today, CNBC released another article on the same topic. This time,
the article features opposing points of view from notable researchers.
Some experts agree that the rise of ETFs has caused the volatility to
decline
“There’s no one resounding answer to [why we’ve seen] this low
volatility,” Repetto, who covers the brokers and exchanges, said Tuesday
on CNBC”s “Trading Nation.” But the growth of assets in exchange-traded
funds, which largely track indexes, “has had some impact.” Repetto pointed out that the first quarter of 2017 was the least
volatile quarter for the S&P 500 in decades — which is just one
among a host of stats showing how anomalous the lack of market movement
has been.
While some disagree:
“To a large extent, I disagree that low volatility is being
caused by ETFs,” Meziani, the author of three books about
exchange-traded funds, told CNBC in a Thursday phone interview. Read more
In previous posts, we presented 2 volatility trading strategies: one strategy is based on the volatility risk premium (VRP) and the other on the volatility term structure, or roll yield (RY). In this post we present a detailed comparison of these 2 strategies and analyze their recent performance.
The first strategy (VRP) is based on the volatility risk premium. The trading rules are as follows [1]:
Buy (or Cover) VXX if VIX index <= 5D average of 10D HV of SP500
Sell (or Short) VXX if VIX index > 5D average of 10D HV of SP500
The second strategy (RY) is based on the contango/backwardation state
of the volatility term structure. The trading rules are as follows:
Buy (or Cover) VXX if 5-Day Moving Average of VIX/VXV >=1 (i.e. backwardation)
Sell (or Short) VXX if 5-Day Moving Average of VIX/VXV < 1 (i.e. contango)
Table below presents the backtested results from January 2009 to
December 2016. The starting capital is $10000 and is fully invested in
each trade (different position sizing scheme will yield different ending
values for the portfolios. But the percentage return of each trade
remains the same)
RY
VRP
Initial capital
10000
10000
Ending capital
179297.46
323309.02
Net Profit
169297.46
313309.02
Net Profit %
1692.97%
3133.09%
Exposure %
99.47%
99.19%
Net Risk Adjusted Return %
1702.07%
3158.54%
Annual Return %
44.22%
55.43%
Risk Adjusted Return %
44.46%
55.88%
Max. system % drawdown
-50.07%
-79.47%
Number of trades trades
32
55
Winners
15 (46.88 %)
38 (69.09 %)
We observe that RY produced less trades, has a lower annualized
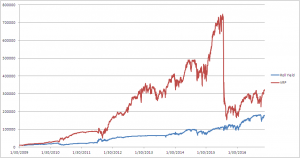
return, but less drawdown than VRP. The graph below depicts the
portfolio equities for the 2 strategies. Portfolio equity for the VRP and RY strategies
It is seen from the graph that VRP suffered a big loss during the
selloff of Aug 2015, while RY performed much better. In the next section
we will investigate the reasons behind the drawdown.
Performance during August 2015
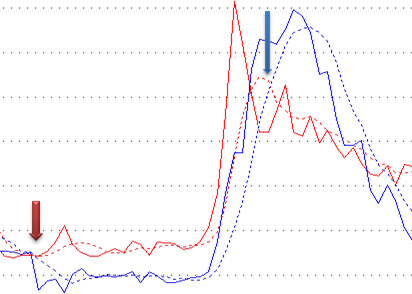
The graph below depicts the 10-day HV of SP500 (blue solid line), its
5-day moving average (blue dashed line), the VIX index (red solid line)
and its 5-day moving average (red dashed line) during July and August
2015. As we can see, an entry signal to go short was generated on July
21 (red arrow). The trade stayed short until an exit signal was
triggered on Aug 31 (blue arrow). The system exited the trade with a
large loss. 10-day Historical Volatility and VIX
The reason why the system stayed in the trade while SP500 was going
down is that during that period, the VIX was always higher than 5D MA of
10D HV. This means that 10D HV was not a good approximate for the
actual volatility during this highly volatile period. Recall that the
expectation value of the future realized volatility is not observable.
This drawdown provides a clear example that estimating actual volatility
is not a trivial task.
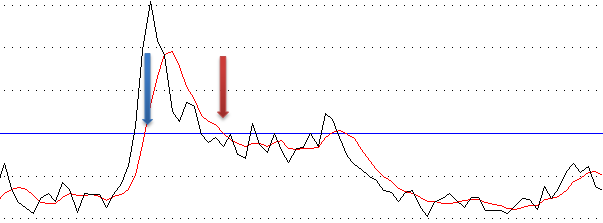
By contrast, the RY strategy was more responsive to the change in
market condition. It went long during the Aug selloff (blue arrow in the
graph below) and exited the trade with a gain. The responsiveness is
due to the fact that both VIX and VXV used to generate trading signals
are observable. The graph below shows VIX/VXV ratio (black line) and its
5D moving average (red line). VIX/VXV ratio
In summary, we prefer the RY strategy because of its responsiveness
and lower drawdown. Both variables used in this strategy are observable.
The VRP, despite being based on a good ground, suffers from a drawback
that one of its variables is not observable. To improve it, one should
come up with a better estimate for the expectation value of the future
realized volatility. This task is, however, not trivial.
References
[1] T Cooper, Easy Volatility Investing, SSRN, 2013


 is the stock volatility, and
  is the time step.