Saturday, December 30, 2023

Quality of Conformance: Definition, Meaning, How to Measure, What Factors Impact

Companies measure various financial metrics to determine performance. However, these metrics do not gauge every aspect of the business. Companies use other non-quantifiable methods to measure those areas. One of these includes the quality of conformance.

What is Quality of Conformance?

The quality of conformance, also known as conformance quality, is a vital aspect of quality management that assesses how well a product or service aligns with specified requirements, standards, or design criteria. It represents the degree to which the actual implementation of a product or service meets the intentional design and planning established by a company or industry standards.

In manufacturing, quality of conformance entails evaluating whether produced goods adhere to specified dimensions, materials, and performance characteristics outlined in the design. Similarly, it involves assessing whether the delivered service aligns with agreed-upon standards, ensuring customer expectations are fulfilled.

What factors impact the Quality of Conformance?

Several factors impact the quality of conformance, including internal and external sources. Some of these are as follows.

Environmental factors

The geographical and environmental conditions can impact conformance quality. Factors such as climate, humidity, and other variables may influence the production or service delivery process and, consequently, the quality of conformance.

Regulatory requirements

Adherence to regulatory requirements is a critical factor affecting conformance. Industries subject to specific regulations must ensure that their processes align with legal standards, and non-compliance can lead to deviations in product quality.

Supply chain resilience

The resilience of the supply chain is crucial. Disruptions, delays, or inconsistencies in the supply chain can affect the availability and quality of inputs, directly impacting the conformance quality of the final product or service.

Communication and collaboration

Effective communication and collaboration between different departments and teams are essential. Clear communication of standards and expectations ensures that everyone involved understands and follows the prescribed procedures.

How to measure the Quality of Conformance?

Companies employ various methods and tools to gauge the quality of conformance, assessing the extent to which their products or services adhere to established standards and specifications. These measurement techniques help businesses identify deviations, improve processes, and enhance overall quality.

However, there is no specific method to calculate or measure the quality of conformance as it is not quantifiable. Instead, companies use various approaches to determine what this quality is. Some of those are as follows.

Data analytics and machine learning

Leveraging data analytics and machine learning algorithms allows companies to analyze large datasets for patterns and anomalies. These technologies can identify trends and deviations, providing insights into conformance quality.

Supplier scorecards

Supplier scorecards systematically evaluate and rate suppliers based on various performance metrics, including the quality of delivered goods. This approach helps companies assess how suppliers conform to specified quality standards.

Failure mode and effects analysis (FMEA)

FMEA is a systematic method for evaluating potential failure modes within a process and their potential effects. By identifying failure points, companies can proactively address issues affecting conformance.

Process monitoring

Real-time monitoring of in-process parameters helps identify deviations as they occur. Companies use sensors and monitoring devices to assess conformance during the production or service delivery stage.

Conclusion

Quality of conformance measures a product or service against specific requirements, standards, etc. Various elements may impact it, including environmental factors, regulations, supply chain resilience, etc. However, companies cannot quantify the quality of conformance. Instead, they use other methods to gauge it.

Article Source Here: Quality of Conformance: Definition, Meaning, How to Measure, What Factors Impact


source https://harbourfronts.com/quality-of-conformance/

Friday, December 29, 2023

Can Trading Volume Predict Realized Volatility?

Realized volatility (RV) is a measure that captures the degree of price fluctuation in a financial instrument over a specific period. This metric is valuable for investors and traders as it reflects the true price action experienced by an asset, aiding in risk assessment and strategy development. Realized volatility contrasts with implied volatility, which is derived from option prices and represents market expectations.

There is a body of research literature that demonstrates a relationship between realized volatility (RV) and trading volume (VOL).  Reference [1] addresses the same research subject but employs different methods, including the Granger causality test, Mean Square Error, and Mean Average Error models. The author pointed out,

The aim of this study was to investigate the relationship between RV and VOL, to ascertain or rebuff the sequential information and the mixed distribution theories as well as the findings of prior literature using the most recent data. The results of this study reveals that there is no meaningful relationship between RV and VOL, hence they cannot be used as estimators to predict one another. Based on the findings of this study, sequential information and mixed distribution theories are irrelevant, at least in the current dispensation. The findings of this study also suggests that new information entering financial markets tend to be disseminated faster to active market participants probably due to regional and global integration. Also, financial market contagion which has increased recently may be a propelling factor for new information transmission. Since there is no relationship between RV and VOL, traders may need to rely on other indicators or factors to make trading decisions. They may need to adjust their strategies to incorporate different signals or factors that are more relevant for predicting market movements or identifying trading opportunities.

In short, contrary to the majority of research papers, the author demonstrates that there is no relationship between VOL and RV except for the CAC 40.

This result is surprising. It proves that the market is highly efficient.

Let us know what you think in the comments below or in the discussion forum.

References

[1] Samuel Tabot Enow, Exploring the relation between realised volatility and trading volume: evidence from international stock market, Journal of Management and Entrepreneurship Research 4(2):82-90

Post Source Here: Can Trading Volume Predict Realized Volatility?


source https://harbourfronts.com/can-trading-volume-predict-realized-volatility/

Thursday, December 28, 2023

Supportive Leadership: Definition, Examples, Styles, Principles

In the realm of effective leadership, the paradigm of Supportive Leadership has emerged as a guiding light, emphasizing empathy, collaboration, and mentorship. This blog post explores the essence of Supportive Leadership, unraveling its main principles, applicability across diverse settings, and its transformative impact on individuals and organizations.

Understanding Supportive Leadership

At its core, Supportive Leadership is a people-centric approach that prioritizes the well-being and development of team members. It goes beyond traditional hierarchical structures, fostering a culture of trust, open communication, and empowerment.

Main Principles of Supportive Leadership

  1. Empathy and Understanding: Supportive leaders cultivate empathy, seeking to understand the perspectives, challenges, and aspirations of their team members. This creates a foundation for authentic connections.
  2. Open Communication: Transparent and open communication is a hallmark of Supportive Leadership. Leaders encourage a culture where ideas, feedback, and concerns are freely shared, fostering a collaborative environment.
  3. Empowerment and Trust: Supportive leaders trust their team members with responsibilities, empowering them to make decisions and contribute meaningfully. Trust is the cornerstone upon which collaboration and innovation thrive.
  4. Mentorship and Development: Prioritizing the growth and development of team members, supportive leaders act as mentors, providing guidance, resources, and opportunities for skill enhancement.
  5. Recognition and Appreciation: Acknowledging and appreciating the contributions of team members is integral to Supportive Leadership. Recognition fosters a positive work environment and motivates individuals to excel.

Applicability in Various Settings

  1. Corporate Environments: Supportive Leadership is particularly impactful in corporate settings, where it enhances employee engagement, reduces turnover, and fosters a culture of continuous improvement.
  2. Educational Institutions: In educational settings, supportive leadership encourages collaboration among educators, promotes student-centric approaches, and facilitates an environment conducive to learning and innovation.
  3. Nonprofit Organizations: Supportive Leadership proves essential in the nonprofit sector, fostering a shared sense of purpose, commitment, and passion among team members working toward a common mission.

Transformative Impact

  1. Enhanced Productivity: By prioritizing the well-being and development of team members, supportive leaders cultivate a motivated and engaged workforce, ultimately leading to increased productivity.
  2. Positive Organizational Culture: Supportive Leadership contributes to the creation of a positive organizational culture, characterized by trust, collaboration, and a shared commitment to success.
  3. Employee Retention: The supportive leadership model is instrumental in retaining talent. Employees are more likely to stay in an environment where they feel valued, supported, and have opportunities for growth.

Conclusion

Supportive Leadership stands as a beacon in the evolving landscape of leadership philosophies. It embodies the belief that the success of an organization is intrinsically tied to the well-being and growth of its people. As individuals and organizations navigate the complexities of the modern world, embracing the principles of Supportive Leadership becomes not only a strategic choice but a profound commitment to the holistic development of those who contribute to shared goals and aspirations.

Post Source Here: Supportive Leadership: Definition, Examples, Styles, Principles


source https://harbourfronts.com/supportive-leadership/

Wednesday, December 27, 2023

Skimming Fraud: What It Is, Examples, Meaning, Prevention

Frauds are not very uncommon when it comes to transactions and dealing with money. People often try to take advantage and cheat others out of their hard-earned money through various fraudulent schemes. One such type of fraud is known as skimming fraud.

Skimming fraud involves illegally obtaining credit or debit card information from a victim's card without their knowledge or consent. It's important to understand how this type of fraud works to protect from falling victim to it.

What is Skimming Fraud?

'Skimming Fraud' is a dishonest trick that some people use to steal credit card details without the card owner knowing about it.

These people often use a tool known as a skimmer, which they put on places like gas station pumps or ATM machines to gather card information. Some of these tools work like the machines used in shops.

When a card is swiped through them, they can capture security code inputs. It's always advised for cardholders to keep their cards within their sight and to hide the pin pad when entering security codes at ATMs.

How Skimming Fraud Works

Skimming fraud is simply the theft of credit card information. The fraudulent person will use a small device called a skimmer that is attached to an ATM, gas pump, or other point-of-sale machines.

When a person swipes their card through the skimmer, it captures and stores all the details stored in the card's magnetic strip. Some skimmers also have fake keypads to capture PINs when they are entered.

The thief later comes back, retrieves the skimmer, and downloads the stolen credit card information. They can then use this information to make fraudulent purchases or even create clone cards.

Everyone needs to be cautious while using their cards, especially at ATMs and gas stations, to protect themselves from such fraud.

How to Stay Away From Skimming Fraud

There are several measures individuals can take to protect themselves from skimming fraud - some of these include

  • Check for any signs of tampering or suspicious devices attached to ATMs or gas pumps before using them.
  • Covering the pin pad when entering security codes at ATMs.
  • Use contactless payment methods whenever possible, as skimmers cannot gather information from these types of transactions.
  • Regularly checking bank and credit card statements for any unauthorized charges or suspicious activity.
  • Immediately report any lost or stolen cards to the relevant financial institutions.
  • Take precautions while shopping online and avoid using public Wi-Fi when making online purchases or entering credit card information.
  • Using two-factor authentication for online accounts and regularly changing passwords.

Taking these preventative measures can greatly reduce the risk of falling victim to skimming fraud.

Conclusion

Skimming fraud is a serious and prevalent type of fraud that can cause significant financial losses and damage to individuals. It's important to be aware of how it works and take necessary precautions to protect from it. By understanding the signs and taking preventative measures, individuals can greatly reduce their chances of becoming a victim of skimming fraud.

Post Source Here: Skimming Fraud: What It Is, Examples, Meaning, Prevention


source https://harbourfronts.com/skimming-fraud/

Burden Rate: Definition, Formula, Calculation, Examples, Types

Indirect costs can be highly crucial to a company’s profitability. Companies must determine and quantify these costs to ensure accurate accounting. Therefore, they can use the burden rate.

What is the Burden Rate?

The burden rate (or overhead rate) is a percentage or predetermined rate used to quantify the indirect costs associated with manufacturing or providing services. These indirect costs, including expenses like rent, utilities, indirect labor, and equipment depreciation, are not directly attributable to a specific product or service but are crucial to support overall production activities.

Companies can calculate the burden rate by dividing indirect costs by direct labor costs and multiplying by 100. By applying this rate to direct labor costs, companies can gain insights into the comprehensive cost of production, aiding in pricing decisions, cost analysis, and financial planning. Understanding and appropriately managing the burden rate is vital for businesses seeking to determine the cost of their products or services and enhance overall operational efficiency.

What is the formula for the Burden Rate?

Companies can calculate the burden rate by following a straightforward formula of the ratio of indirect costs to direct labor costs.

Burden Rate = Indirect costs / Direct labor costs x 100

The above burden rate formula represents the percentage of indirect costs relative to direct labor costs. This rate is applied to direct labor costs to allocate indirect costs more accurately and determine the total cost of production.

What are the types of Burden Rate?

Typically, burden rate refers to the ratio between direct and indirect costs. However, companies can calculate this rate for specific areas of their operations. Some of the prevalent types of burden rate include the following.

Labor burden

Labor burden refers to the indirect costs of employing workers beyond their wages or salaries. It includes expenses, such as payroll taxes, benefits (health insurance, retirement contributions), and other employer-related costs. Companies can calculate the labor burden rate by dividing the total indirect labor costs by the direct labor costs.

Inventory burden

Inventory burden (or carrying cost) encompasses the indirect costs associated with holding and storing inventory. It includes costs like warehousing, insurance, taxes, and the opportunity cost of tying up capital in unsold goods. The inventory burden rate is calculated by dividing the total indirect inventory costs by the inventory value.

Manufacturing overhead burden

Manufacturing overhead burden includes indirect costs related to the production process, not directly traceable to specific units. It includes costs, such as utilities, depreciation on manufacturing equipment, maintenance, and factory management salaries. The manufacturing overhead burden rate is often applied to direct labor costs or machine hours.

What is the importance of the Burden Rate?

Understanding and calculating burden rates holds pivotal importance for businesses across various industries. Firstly, it ensures accurate cost determination by incorporating indirect costs linked with labor, inventory, manufacturing, or projects. This comprehensive approach accurately represents the total expenses incurred in producing goods or services, aiding businesses in making informed decisions about pricing strategies and profitability analysis.

Burden rates also play a crucial role in budgeting and planning, allowing organizations to forecast future costs, allocate resources efficiently, and set realistic financial targets. Moreover, they contribute to cost control and efficiency improvement efforts, helping identify areas where indirect costs may be escalating, thus facilitating measures to enhance operational effectiveness.

Conclusion

Burden rate is a metric that helps companies measure the indirect costs involved in the production process. Typically, companies calculate it by dividing indirect costs over direct labor costs. However, companies may also use the same principle to quantify indirect costs in various areas, including labor, inventory, and manufacturing overheads.

Originally Published Here: Burden Rate: Definition, Formula, Calculation, Examples, Types


source https://harbourfronts.com/burden-rate/

Tuesday, December 26, 2023

Can Dividend Yield Predict Stock Returns?

Dividend yield is a financial metric that provides insight into the income generated by an investment in the form of dividends, relative to its market price. Expressed as a percentage, the dividend yield is calculated by dividing the annual dividend per share by the current market price per share. This measure is particularly valuable for income-oriented investors seeking stable returns from their investments.

Reference [1] explores the connection between dividend yield, stock volatility, and expected returns. Volatility is measured as the trailing twelve-month average of the difference between monthly high and low prices. The authors pointed out,

We provide empirical evidence that excessively volatile prices drive the return predictability. Inter-temporally, dividend yields are highly profitable following periods of heightened volatility, generating approximately 1.5% per month, but these are the only periods when yield strategies generate significant returns. Similarly, in the cross-section, dividend yield predicts returns amongst volatile firms. While we find strong evidence that, during periods of high return volatility, dividend yield strategies generate significant returns, over the entirety of our sample computing dividend yield by scaling dividends by current prices generates similar returns to scaling by prices lagged one year. These results suggest that to the extent dividend yield predicts returns, this on average effect is not due to excessively volatile prices within the past year.

In short, the article showed that,

  • Dividend yield serves as a good predictor of future returns, and yield strategies give substantial profits, approximately 1.5% per month following periods of heightened volatility.
  • In the cross-section, dividend yield provides more accurate predictions for returns in volatile firms.

This article provides additional theoretical support for dividend investing.

Let us know what you think in the comments below or in the discussion forum.

References

[1] Ahn, Seong Jin and Ham, Charles and Kaplan, Zachary and Milbourn, Todd T., Volatility, dividend yield and stock returns (2023). https://ift.tt/UDtX4wm

Post Source Here: Can Dividend Yield Predict Stock Returns?


source https://harbourfronts.com/can-dividend-yield-predict-stock-returns/

Sunday, December 24, 2023

Working Capital Cycle: Definition, Interpretation, Formula, Example, Meaning, Calculation

In business, there's a critical process called the Working Capital Cycle. It's like the heartbeat of a company, keeping everything running smoothly.

This cycle is a key part of how businesses manage their money and keep operations going. Understanding it can unlock insights into a company's financial health.

It is a crucial tool used by financial analysts, investors, and business owners alike so managing and optimizing this cycle is crucial for a company's success.

What is Working Capital Cycle?

The Working Capital Cycle is a measure of how efficiently a business manages its operations. It's all about the time it needs to turn net working capital - that is, the difference between current assets and current liabilities - back into cash.

This cycle plays a crucial role in maintaining a company's cash flow.

The cycle involves three key steps

  • Selling inventory
  • Collecting payments from customers
  • Paying off bills

Each step needs to be managed carefully - for instance, a business aims to sell its inventory as fast as possible.

Then, it tries to collect payments from its customers promptly. Finally, when it comes to paying bills, the goal is to take as much time as allowed without penalties.

This delicate balancing act is critical for optimizing cash flow. A well-managed Working Capital Cycle can help a business stay financially healthy and ready for growth.

How Working Capital Cycle works

The Working Capital Cycle is a key process for businesses - here's how it typically works

  1. First, a company buys materials to make a product using credit. Let's say they have around 90 days to pay for these supplies (this is known as payable days).
  2. Next, the company manages to sell its stock within an average of 85 days (these are inventory days).
  3. Finally, after selling the products, the company gets paid by its customers within an average of 20 days (these are called receivable days).

In simple words, the Working Capital Cycle is this entire process of buying materials on credit, selling them, and then receiving payment. It's a vital part of managing a company's cash flow.

Formula of Working Capital Cycle

Here is the formula for calculating the Working Capital Cycle

Working Capital Cycle = Inventory Days + Receivable Days - Payable Days

  1. Inventory days: This represents the average number of days it takes for a company to sell its inventory. A lower number here indicates that products are selling quickly and efficiently.
  2. Receivable days: This is the average time it takes for a business to receive payment from its customers after making a sale. A shorter time frame means fast and efficient collection of payments.
  3. Payable days: This is the average time a company takes to pay its suppliers. A longer number here means that a business has more time to pay off its debts.

Example of Working Capital Cycle Calculation

Inventory Days = 85

Receivable Days = 20

Payable Days = 90

Working Capital Cycle = Inventory Days + Receivable Days - Payable Days

= (85+20)-90

= 15 days

As you can see from the example, a shorter Working Capital Cycle is more desirable as it indicates that a company can quickly turn its inventory into cash and also collect payments efficiently.

Conclusion

The working capital cycle is a crucial process for businesses to manage their cash flow and stay financially healthy. By understanding and effectively managing this cycle, companies can increase efficiency, reduce costs, and improve overall financial performance. It's an essential tool for any business owner or financial professional to monitor and optimize regularly.

Originally Published Here: Working Capital Cycle: Definition, Interpretation, Formula, Example, Meaning, Calculation


source https://harbourfronts.com/working-capital-cycle/

Saturday, December 23, 2023

Null Hypothesis: What It Is, Examples, Usage, Meaning, Formula

In the realm of scientific inquiry, the null hypothesis is an unsung hero, quietly shaping the landscape of experiments and investigations. Let's unravel the mystery behind this often-overlooked concept and understand its pivotal role in the pursuit of knowledge.

What is the Null Hypothesis?

At its core, the null hypothesis serves as a baseline assumption, a stance that there is no significant difference or effect. It acts as the default position that researchers aim to challenge, question, or reject through their experiments. While it may seem counterintuitive, proving the null hypothesis true is seldom the goal; instead, researchers strive to find evidence that contradicts or challenges this initial assumption.

Examples of Null Hypotheses

  1. Medical Trials:

- Null Hypothesis: The new drug has no significant effect on patient recovery.

- Alternative Hypothesis: The new drug significantly improves patient recovery.

  1. Education Research:

- Null Hypothesis: There is no significant difference in test scores between students who receive traditional teaching and those who undergo a new teaching method.

- Alternative Hypothesis: The new teaching method leads to a significant improvement in test scores.

  1. Economic Studies:

- Null Hypothesis: Changes in taxation policy have no significant impact on overall economic growth.

- Alternative Hypothesis: Changes in taxation policy significantly affect overall economic growth.

The Significance of Null Hypothesis Testing

Researchers conduct statistical analyses to determine whether their observed results are statistically significant or merely due to chance. If the evidence is strong enough to reject the null hypothesis, it opens the door to new insights, theories, or practical applications. However, if the evidence is insufficient, the null hypothesis stands, guiding researchers to reevaluate their assumptions and methods.

Conclusion

The null hypothesis, often overshadowed by its more glamorous counterpart, plays a crucial role in the scientific method. It serves as a compass, guiding researchers through the intricate terrain of uncertainty and providing a benchmark for scientific exploration. Embracing the null hypothesis is not a concession but a strategic starting point, fostering a deeper understanding of the phenomena under investigation.

Post Source Here: Null Hypothesis: What It Is, Examples, Usage, Meaning, Formula


source https://harbourfronts.com/null-hypothesis/

Friday, December 22, 2023

Reversing Entries: What They Are, Definition, Examples, Meaning, Benefits

Reversing entries are crucial adjustments that companies make in every fiscal period. Therefore, it is critical to understand what they are and how they impact accounting.

What are Reversing Entries?

Reversing entries in accounting are adjustments made at the beginning of a new accounting period to counteract the impact of adjusting entries made at the end of the previous period. These adjusting entries, which handle accruals and deferrals, ensure that revenues and expenses get recognized in the correct period. Reversing entries simplify the accounting process by nullifying the effects of these adjustments.

The primary advantage of reversing entries is their ability to streamline accounting procedures. By removing the effects of specific adjusting entries from the prior period, accountants can focus on the new period's transactions without the complication of considering adjustments made in the previous period. While not all adjusting entries require reversing entries, they are a practical tool to enhance efficiency and accuracy in financial reporting.

How do Reversing Entries work?

Reversing entries operate by simplifying the accounting process and facilitating a smoother transition from one accounting period to the next. Their functionality is grounded in reversing specific adjusting entries made in the previous period. Reversing entries apply to two cases: accruals and deferrals.

In the case of accruals, if the prior period recognized revenue or expenses that were earned or incurred but not yet recorded, a reversing entry is made at the beginning of the new period. This entry effectively cancels out the impact of the accrual, making it easier to record the actual transaction in the next period when it occurs. For instance, if services were rendered but not yet billed, the reversing entry ensures a clean slate for billing and revenue recognition in the current period.

For deferrals, if the previous period involved deferring the recognition of revenue or expenses to a future period, a reversing entry is employed. This entry removes the deferral, allowing the recognition of income or expenses in the new period when they occur. For example, if prepaid expenses were deferred in the prior period, the reversing entry ensures that these expenses are recognized in the current period, aligning with the actual occurrence.

Why do companies need Reversing Entries?

Reversing entries meet the fundamental need to simplify and enhance the accuracy of the accounting process during the transition between accounting periods. Adjusting entries is crucial for correctly recognizing revenues and expenses, but they can create complications when dealing with routine transactions in the new period.

Reversing entries address this by erasing the impact of specific adjustments, providing a clean slate for recording actual transactions in the fresh period. This simplification not only streamlines the accounting workflow but also reduces the risk of errors and misinterpretations that arise from the complexities of adjusting entries from the previous period and new transactions in the current period.

What is an example of a Reversing Entry?

A company, Red Co., estimates its utility expense to be $10,000 for an accounting period. However, the company did not receive a bill for it until after the period. Under accounting principles, Red Co. still records the expense using the following entry.

Dr Utility expense $10,000
Cr Accrued expenses $10,000

In the next period, Red Co. receives the bill, which is $11,000. Therefore, the company reverses the one recorded in the previous period first using the following entry.

Dr Accrued expenses $10,000
Cr Utility expense $10,000

Once reversed, Red Co. records the actual expense as follows.

Dr Utility expense $11,000
Cr Accrued expenses $11,000

Conclusion

Reversing entries are adjustments made in every accounting period to remove the impact of adjusting entries made in the previous one. These entries usually apply in two cases: accruals and deferrals. Companies need reversing entries to comply with the requirements under accounting principles and to maintain accurate financial records.

Originally Published Here: Reversing Entries: What They Are, Definition, Examples, Meaning, Benefits


source https://harbourfronts.com/reversing-entries/

Thursday, December 21, 2023

Beta Anomaly in the International Stock Markets

Beta is a financial metric that measures the sensitivity of a stock's returns in relation to the overall market. It provides insights into how much a stock tends to move in response to market fluctuations. A beta of 1 indicates the stock generally moves in line with the market, while a beta greater than 1 suggests higher volatility and a beta less than 1 implies lower volatility. A negative beta signifies an inverse relationship with the market. Investors often use beta to assess a stock's risk and to make decisions about portfolio diversification based on their risk tolerance and market expectations.

Reference [1] examines the so-called beta anomaly in the international stock markets. The beta anomaly refers to the observed phenomenon where stocks with low beta outperform stocks with high beta over time. Some explanations for the beta anomaly include behavioral factors, investor preferences, and the impact of market frictions, suggesting that investors may overprice high-beta stocks and underprice low-beta stocks, leading to a persistent market anomaly.

The authors pointed out,

This research assesses the beta anomaly and investigates its relationship with stock quality in international stock markets. We document the existence of the beta anomaly in aggregate and country portfolios and show that stock quality can explain the beta anomaly…

This research offers novel evidence on the relationship between market risk and expected stock returns in international stock portfolios. The findings of this paper provide implications for investors. An investment strategy that is long in low-beta stocks and short in high-beta stocks will generate economically and statistically significant abnormal returns and Sharpe ratio in aggregate and most country portfolios. However, those profits are restricted to low-quality stock portfolios and become insignificant within high-quality stock portfolios. The abnormal returns of a low-high beta portfolio almost double once estimated among junk stocks only. This study suggests that arbitrage opportunities are possible at both the aggregate and country levels and that stock quality should be taken into account to exploit the beta anomaly.

In brief, the beta anomaly is present in the international stock market and among low-quality stocks.

We believe that U.S. investors aren't diversifying internationally enough. This paper offers guidance on how they can diversify in international stock markets.

Let us know what you think in the comments below or in the discussion forum.

References

[1] Bradrania, R., Veron, J.F., & Wu, W. (2023). The beta anomaly and the quality effect in international stock markets. Journal of Behavioral and Experimental Finance 38, 1-18., https://ift.tt/CgeLrkb

Article Source Here: Beta Anomaly in the International Stock Markets


source https://harbourfronts.com/beta-anomaly-international-stock-markets/

Wednesday, December 20, 2023

For Deposit Only Endorsement

In the realm of banking and financial transactions, the "For Deposit Only" endorsement stands as a small yet powerful safeguard, ensuring the secure handling of checks and mitigating the risk of unauthorized transactions. This blog post delves into the significance of the "For Deposit Only" endorsement, its purpose, and the enhanced security it provides in the world of banking.

What is "For Deposit Only" Endorsement?

The "For Deposit Only" endorsement is a directive added to the back of a check, restricting its use to the process of deposit only. When an account holder endorses a check in this manner, they communicate to the bank that the funds should be directed solely to the designated account and not withdrawn as cash.

Purpose and Significance

  1. Enhanced Security: The primary purpose of the "For Deposit Only" endorsement is to enhance the security of check transactions. By explicitly stating that the check is for deposit, it reduces the risk of the check being cashed by an unauthorized party.
  2. Directed Fund Allocation: This endorsement ensures that the funds are directed precisely to the specified account, contributing to accurate and efficient fund allocation.

How to Apply "For Deposit Only" Endorsement

  1. Endorsement Placement: Typically found on the back of the check, the endorsement is placed within the designated area for endorsements.
  2. Exact Wording: The phrase "For Deposit Only" is commonly used, but it's essential to adhere to the exact wording to ensure clarity and adherence to banking regulations.
  3. Account Number: Some individuals also include their account number below the endorsement for additional identification.

Security Measures and Best Practices

  1. Use of Inks: Using permanent inks for endorsements ensures that the directive remains intact and visible throughout the check's processing.
  2. Secure Channels: Whenever possible, checks should be deposited through secure channels, such as ATMs or within the controlled environment of a bank.
  3. Regular Monitoring: Account holders are encouraged to regularly monitor their accounts for any discrepancies or unauthorized transactions, even with the "For Deposit Only" endorsement.

Conclusion

In the evolving landscape of financial transactions, the "For Deposit Only" endorsement emerges as a valuable tool for individuals and businesses seeking to fortify the security of their check deposits. By leveraging this simple yet effective measure, account holders contribute to the robustness of the banking system, ensuring that funds are directed precisely where intended. As we navigate an era of digital finance, these traditional safeguards continue to play a crucial role in maintaining the integrity and security of our financial interactions.

Post Source Here: For Deposit Only Endorsement


source https://harbourfronts.com/for-deposit-only-endorsement/

Tuesday, December 19, 2023

External Analysis: What It Is, Definition, Examples, Importance

When it comes to running a profitable business, both internal and external analysis are crucial.

However, external analysis plays a more significant role as it deals with understanding the market and identifying potential opportunities and threats for the business.

By understanding the external factors that could affect the company, businesses can make informed decisions and create effective strategies to stay ahead of their competitors.

What is External Analysis?

External analysis is taking a good look at a company's business landscape. It's about understanding the industry where the company operates, its rivals, and how things have changed over time.

This also includes looking at bigger-picture factors like

  • The economy
  • Global trends
  • Politics
  • Societal changes
  • Population data
  • Technology developments, etc...

The main goal of external analysis is to identify potential opportunities that can boost profits and growth, as well as threats that could disrupt the business. It's a vital step in planning because it helps predict what could shake up the industry.

How External Factors Work

By understanding how external factors work, businesses can anticipate changes in the industry and adapt accordingly - some of the external factors include

  1. Industry Analysis: This involves studying the overall landscape of a specific industry. It's vital to understand the history, current state, and future outlook of an industry in order to make informed decisions.
  2. Market Segment Analysis: This is about looking at specific customer segments within an industry - such as demographics, behavior patterns, needs, etc... It helps in marketing, understanding customer preferences, and developing products that cater to specific segments.
  3. Competitive Structure Analysis: This includes studying the key players in an industry, their market share, strengths, and weaknesses - it's essential to know who your competitors are and what they're doing.
  4. Competitive Positioning Analysis: This involves analyzing a company's competitive position within the industry - are they leading, following, or lagging behind? It helps in understanding where the company stands and how it can improve its position.
  5. Dynamics Analysis: This is about studying the changes that are happening within an industry - whether it's technological advancements, consumer trends, or regulatory changes. Anticipating these dynamics can help businesses stay ahead of the curve.

Importance of External Analysis

External analysis is crucial for several reasons

  1. Identifying opportunities: By understanding the external factors, businesses can identify potential areas for growth and development.
  2. Identifying threats: External analysis helps in identifying potential risks and threats to the business, allowing companies to mitigate or avoid them.
  3. Strategic planning: With a clear understanding of the external landscape, businesses can create effective strategies that align with market trends and customer needs.
  4. Staying ahead of competitors: By studying the industry, market segments, and competitive structure, businesses can gain a competitive advantage and stay ahead of their competitors.
  5. Predicting changes: External analysis helps in anticipating changes in the industry and preparing for them, allowing businesses to adapt quickly and efficiently.

Conclusion

External analysis is a crucial aspect of running a successful business. By understanding how it works businesses can make informed decisions and stay ahead of their competitors. It's an ongoing process that should be regularly updated to make sure everything is on track and aligned with the external landscape.

Originally Published Here: External Analysis: What It Is, Definition, Examples, Importance


source https://harbourfronts.com/external-analysis/

Monday, December 18, 2023

Cash Flow Statement Direct Method: Definition, Examples, Format, vs Indirect Method, Advantages, Disadvantages

The cash flow is one of the four primary financial statements in accounting. Typically, companies prepare it using the indirect method. However, there is an alternative presentation known as the cash flow statement direct method.

What is the Cash Flow Statement Direct Method?

The cash flow statement prepared using the direct method is a straightforward approach that directly lists cash inflows and outflows related to a company's operating, investing, and financing activities. It begins with the total cash collected from customers in the operating activities section, detailing cash sales and collections from credit customers.

Operating cash payments, such as payments to suppliers and employees, are then separately listed, leading to the net cash provided or used by operating activities. The investing activities section covers cash transactions for buying or selling long-term assets, like equipment or investments. The financing activities section outlines cash transactions with capital providers, including cash received from issuing stock.

How does the Cash Flow Statement Direct Method work?

The direct method of preparing a cash flow statement starts with the actual cash transactions associated with a company's operating, investing, and financing activities. The operating activities section begins with the total cash collected from customers, encompassing cash sales and collections from credit customers.

Cash payments, such as those to suppliers and employees, are then itemized, leading to calculating net cash provided or used by operating activities. The investing activities section covers cash transactions related to the purchase and sale of long-term assets. The financing activities section outlines cash interactions with capital providers, including cash received from issuing stock or taking on debt.

What is the difference between the Cash Flow Statement Direct and Indirect Method?

The direct and indirect methods of preparing a cash flow statement diverge primarily in their approach to presenting operating activities. The direct method takes a straightforward path by directly listing cash transactions, commencing with the total cash collected from customers, and delineating various cash payments. This method offers enhanced transparency, providing a detailed view of the actual cash movements in a company's day-to-day operations.

On the contrary, the indirect method starts with the net income from the income statement and then adjusts non-cash items and changes in working capital to derive the operating cash flow. While it requires additional adjustments to reconcile net income with operating cash flow, the indirect method is more prevalent in practice. This method serves as a bridge between the income statement and the cash flow statement, allowing for a smoother transition from accounting profit to operating cash flow.

What are the advantages and disadvantages of the Cash Flow Direct Method?

The direct method of preparing a cash flow statement offers a clear and intuitive view of a company's cash movements, providing stakeholders with a transparent breakdown of actual cash transactions related to operating activities. This transparency enhances understanding and allows investors, analysts, and management to identify the specific sources and uses of cash readily.

Despite its transparency, the direct method is less common in practice due to certain disadvantages. One notable drawback is that it requires more detailed information and may be time-consuming to implement, especially for companies with complex operations. The direct method necessitates a meticulous breakdown of individual cash transactions, which can be resource-intensive.

Conclusion

The cash flow statement direct method is a different approach to preparing the cash flow statement. Instead of starting from net income, it lists cash inflows and inflows for each category. While this method is straightforward, it is still uncommon in practice. It differs from the indirect method of cash flow statement, which is more prevalent.

Originally Published Here: Cash Flow Statement Direct Method: Definition, Examples, Format, vs Indirect Method, Advantages, Disadvantages


source https://harbourfronts.com/cash-flow-statement-direct-method/

Is the VIX Index a Reliable Predictor of Future Realized Volatility?

The VIX, commonly known as the "fear gauge," is a model-free index that serves as a reflection of market volatility expectations for the upcoming 30 days. Essentially, it represents the price of a basket of short-maturity options. The VIX is calculated from the S&P 500 index options' prices, offering a real-time assessment of investors' collective outlook on market volatility. Elevated VIX values often suggest increased perceived risk and uncertainty in the financial markets.

Reference [1] examines whether the VIX functions as a "fear gauge" or a reliable predictor of future realized volatility. The former has a more sentimental or irrational interpretation. On the other hand, the latter suggests that the VIX could be a reasonable estimate of future realized volatility, implying that the investors who trade call and put options on the stock index are primarily guided by rational analyses rather than emotions. The authors pointed out,

Regression analysis concludes that VIX has a connection with the forward volatility, but sentiments drive short-term swings of VIX. In other words, investors should not extract information from the daily changes of VIX but rather look at the general level of the index. Including the binary variables that represent periods of tranquility and turbulence provided more profound insight into the predictive property of VIX during those periods. VIX behaves differently when the market is stable and calm from market turmoil. VIX positively links to the one-month forward volatility when the market is exceptionally volatile. However, if the market is exceptionally stable, this link has a negative relationship, implying that the volatility index is primarily driven by irrational sentiments such as fear in those periods.

In short, the article concluded that

  • the VIX is linked to future realized volatility, but in the short term, it is influenced by market sentiment.
  • In a stable market, irrational sentiment primarily drives the VIX.
  • In a volatile market, it serves as a more accurate predictor of future volatility.

Let us know what you think in the comments below or in the discussion forum.

References

[1]  Askar Koshoev, The Volatility Index: A Hedging Tool or an Object of Speculation?,  Review of Integrative Business and Economics Research, Vol. 13(2), 1-18

Post Source Here: Is the VIX Index a Reliable Predictor of Future Realized Volatility?


source https://harbourfronts.com/vix-index-predictor-future-realized-volatility/

Saturday, December 16, 2023

Payment Processing Fees: What They Are, Types and Influencing Factors

In the intricate world of financial transactions, payment processing fees play a crucial role, acting as the silent architects behind the seamless transfer of funds. This blog post aims to unravel the complexities surrounding payment processing fees, exploring their types and the factors that wield influence over these charges.

What are Payment Processing Fees?

Payment processing fees are charges incurred for the facilitation of electronic transactions. Whether through credit cards, debit cards, or digital wallets, these fees are the cost levied by payment processors for their services in ensuring secure and swift monetary transfers.

Types of Payment Processing Fees

  1. Interchange Fees: These are fees paid by the merchant's bank to the cardholder's bank to cover the cost of the transaction. They constitute a significant portion of payment processing fees.
  2. Assessment Fees: Charged by credit card companies, assessment fees contribute to the overall cost of processing transactions and maintaining the payment network.
  3. Merchant Account Fees: Merchants may incur fees for maintaining a merchant account, allowing them to accept electronic payments. These fees vary and may include monthly charges or per-transaction fees.
  4. Flat Fees: Some processors charge a fixed fee per transaction, irrespective of the transaction amount. This provides simplicity for small businesses with consistent transaction sizes.

Factors Influencing Payment Processing Fees

  1. Transaction Volume: Businesses processing higher transaction volumes often negotiate lower fees. Bulk transactions may warrant reduced per-transaction costs.
  2. Business Type: The nature of the business influences fees. High-risk industries, such as gaming or travel, may face elevated fees due to increased transaction scrutiny.
  3. Payment Method: Different payment methods incur varying processing costs. Credit card transactions often have higher fees than ACH transfers or direct bank payments.
  4. Card Type: Credit card types impact fees. Premium or rewards cards tend to incur higher interchange fees, affecting the overall processing cost.
  5. Security Measures: Merchants implementing robust security measures, such as PCI compliance, may qualify for lower fees as the risk of fraud decreases.

Mitigating Costs and Choosing Wisely

Understanding the intricacies of payment processing fees empowers businesses to make informed choices. Negotiating with payment processors, implementing efficient payment methods, and staying abreast of industry changes contribute to cost mitigation strategies.

Conclusion

As the digital landscape continues to redefine the way we transact, comprehending payment processing fees becomes integral for businesses and consumers alike. Navigating this financial terrain requires a nuanced understanding of the types of fees, the factors shaping their magnitude, and proactive strategies to optimize transaction costs. In this dynamic environment, knowledge becomes a potent tool for financial dexterity and operational efficiency.

Post Source Here: Payment Processing Fees: What They Are, Types and Influencing Factors


source https://harbourfronts.com/payment-processing-fees/

Friday, December 15, 2023

Marginal Analysis: Definition, Examples, Meaning, Importance, Limitations

In business, the cost and benefit is an important aspect that must be considered when making decisions. Marginal analysis is a tool that helps decision-makers evaluate the additional costs and benefits of a certain action or decision.

The concept of marginal analysis can be a very useful tool in understanding the impact of small changes in a business or economic decision. It basically helps in identifying the point where the additional cost of an action can either be justified or not.

What is Marginal Analysis?

Marginal analysis is basically weighing the pros and cons of a business move. It's all about looking at the extra perks that come with a certain action and measuring them against the added costs it brings.

So, if a company is thinking about making a change - like producing more products or hiring more staff - marginal analysis helps to figure out if the benefits outweigh the costs.

It can be a great tool that can help a company spot the most profitable options. All in all, it's about making smart decisions based on cost and benefit comparisons.

How Marginal Analysis Works

At its core, marginal analysis is a simple concept - it involves looking at the costs and benefits of a decision in small increments or "marginal units".

For example, let's say a company is considering producing 100 more units of their product. The cost of producing these additional units would include factors like additional materials, labor, and overhead costs.

The benefit would be the revenue generated from selling those additional units. Marginal analysis helps to determine if the added cost of producing and selling those 100 units is worth the potential revenue it will bring in.

Limitations of Marginal Analysis

While marginal analysis can be a useful tool, it also has its limitations. It assumes that the benefits and costs are easily quantifiable and measurable - which is not always the case.

It also relies on accurate data to make informed decisions, which may not always be available or reliable.

Additionally, marginal analysis does not take into account external factors such as market trends, competition, and unforeseen events that could affect the outcome of a decision.

This means that while marginal analysis can provide valuable insights, it should not be the only factor considered when making important business decisions.

Example of Marginal Analysis in Action

To better understand how marginal analysis works, let's use a real-life example.

Suppose a company is considering increasing the price of its product by $5. The cost of producing each unit remains the same, but they expect that sales will decrease by 10%.

Using marginal analysis, they can calculate the additional revenue from the price increase and compare it to the cost of producing those units.

This means for every 100 units sold, the company would earn an extra $500 in revenue but would lose $50 from the decrease in sales.

Based on this analysis, if the added revenue is greater than the added cost, then increasing the price by $5 would be a profitable move for the company.

Conclusion

When it comes to decision-making and maximizing profits, marginal analysis is a valuable tool to have in the arsenal. It helps businesses make informed decisions by evaluating the costs and benefits of a particular action or decision. However, it should be only used to an idea of the potential costs and benefits and not be relied on solely.

Post Source Here: Marginal Analysis: Definition, Examples, Meaning, Importance, Limitations


source https://harbourfronts.com/marginal-analysis/

Thursday, December 14, 2023

Operating Assets: Definition, Types, Formula, Example, Management, Meaning

Companies require assets to generate revenues and run operations. However, not all of those resources may be essential for a company’s activities. Operating assets help run operations and build a company. Therefore, it is crucial to understand what they are.

What are Operating Assets?

Operating assets are the essential tools that companies use daily to conduct their business and generate revenue. These assets, which can include physical items like machinery, buildings, and inventory, are crucial for the company's core operations. For instance, manufacturing companies rely on machinery and inventory, while retail businesses use inventory and cash for day-to-day transactions.

Critical components of operating assets encompass tangible items like machinery and inventory and intangible elements such as patents and brand value. These assets are crucial in daily business operations, ensuring companies can produce goods or deliver services efficiently. For example, a restaurant's kitchen equipment and food inventory are fundamental operating assets, contributing directly to its revenue generation.

What are the types of Operating Assets?

Operating assets may fall into many categories based on their usage in a company. Some of the prevalent items included within these are the following.

Property, plant, and equipment

Property, plant, and equipment consist of physical assets like buildings, machinery, and vehicles crucial for production or service delivery. Examples range from a bakery's ovens to a construction company's heavy machinery, all playing essential roles in day-to-day operations.

Inventory

Inventory is a crucial operating asset, representing the goods a company holds for sale or the materials used in production. Whether it's a retail store managing stock for customer purchase or a manufacturer storing raw materials and finished products, effective inventory management is vital for a smooth operational flow.

Accounts receivable

Accounts receivable represent future income for a business. This operating asset comprises amounts owed by customers for delivered goods or services. It reflects the company's expectation of receiving payment, contributing to its cash flow and overall financial health.

Cash and cash equivalent

Cash and cash equivalents are a company's liquid assets, including actual cash and easily convertible short-term investments. These assets act as a financial lifeline, supporting daily operational needs and ensuring the company meets immediate financial obligations.

How to calculate Operating Assets?

Companies can calculate operating assets by removing those falling under the non-operating category from total assets. The formula for it is as below.

Operating assets = Total assets - Non-operating assets

Alternatively, the formula for operating assets may include the sum of all items falling within it, as follows.

Operating assets = Accounts receivable + Cash and cash equivalents + Inventory + Property, plant and equipment + Other operating assets

What is the importance of Operating Assets?

Operating assets form the backbone of a business, playing a pivotal role in its daily operations and financial well-being. These assets, including tangible ones like machinery and inventory or intangible assets such as patents and goodwill, directly contribute to revenue generation and operational efficiency. Tangible assets like property, plant, and equipment provide the infrastructure for production, while cash and cash equivalents ensure liquidity for immediate needs.

The effective management of operating assets is critical for maintaining positive cash flow and meeting short-term obligations while also establishing a competitive advantage through intangible assets that differentiate the business in the market. Beyond the immediate operational impact, operating assets influence strategic decision-making, investor confidence, and overall financial health.

Conclusion

Operating assets are resources that companies use as a part of their operations. These can be long-term, for example, property, plant, and equipment, or short-term like inventory or cash. Companies can calculate operating assets using different methods. These assets are crucial in helping companies generate revenues and continue operations.

Post Source Here: Operating Assets: Definition, Types, Formula, Example, Management, Meaning


source https://harbourfronts.com/operating-assets/

Profitability of Dispersion Trading in a Less Liquid Market

Dispersion trading is an options trading strategy that capitalizes on the spread or difference in implied volatility between index options and individual stock options. The basic premise involves selling index options while simultaneously buying options on individual components of the index. Traders expect that the implied volatility of individual stocks will either increase or decrease less than that of the overall index.

Reference [1] investigated the profitability of dispersion trading in the Swedish market. The authors pointed out,

The simulation proved that the vega risk could be well hedged using the proposed strategy. Under the condition that no transaction costs are paid during the simulation, the hedging method would also result in positive results. Although the returns from the strategy are notably high, taking into account the substantial transaction costs renders the strategy unprofitable during the simulated period. The large transaction costs are the result of the weights in the tracking portfolio being re-calculated on a daily basis. A less frequent re-balancing of the weights in the tracking portfolio would result in lower transaction costs but would likely result in a worse hedge and lower correlation to the index. The profitability when trading at mid spread is a consequence of expensive index volatility being hedged with cheap single-stock volatility.

In short, the study concluded that if we use the mid-price, then dispersion trading is profitable. However, when considering transaction costs and the B/A spreads, the strategy becomes less profitable.

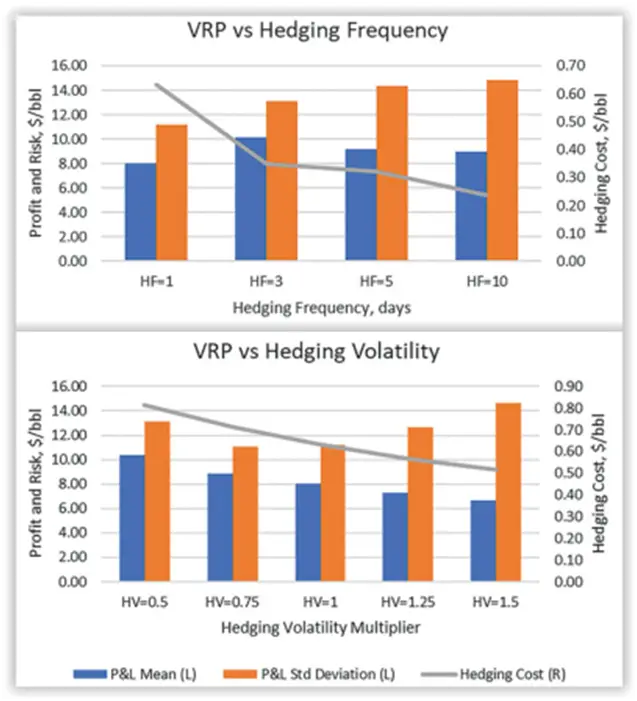
We agree with the author that the strategy can be improved by hedging less frequently. However, this will lead to an increase in PnL variance. But we note that this does not necessarily result in a smaller expected return.

Let us know what you think in the comments below or in the discussion forum.

References

[1]  Albin Irell Fridlund and Johanna Heberlei, Dispersion Trading: A Way to Hedge Vega Risk in Index Options,  2023, KTH Royal Institute of Technology

Originally Published Here: Profitability of Dispersion Trading in a Less Liquid Market


source https://harbourfronts.com/profitability-dispersion-trading-less-liquid-market/

Tuesday, December 12, 2023

Letter of Commitment: What It Is, Purpose, Importance, Examples

In the realm of financial transactions, the Letter of Commitment stands as a pivotal document, forging a formalized bond between lenders and borrowers. This blog post endeavors to unravel the significance, elements, and implications of the Letter of Commitment in the dynamic landscape of lending.

What is a Letter of Commitment?

A Letter of Commitment is a written agreement between a lender and a borrower, delineating the terms and conditions under which the lender is prepared to extend credit or provide financing. This document serves as a cornerstone in the lending process, outlining the commitment of the lender to offer financial support and the expectations and responsibilities of the borrower.

Key Elements

  1. Loan Terms: The Letter of Commitment explicitly specifies the terms of the loan, including the loan amount, interest rate, repayment schedule, and any applicable fees.
  2. Conditions Precedent: It outlines conditions that must be met before the commitment becomes binding. These can include legal requirements, collateral arrangements, or other stipulations.
  3. Expiration Date: The letter typically has an expiration date, after which the commitment may no longer be valid. This ensures that the terms remain relevant and reflective of the current financial landscape.

Purpose and Significance

  1. Clarity and Assurance: For the borrower, the Letter of Commitment provides clarity regarding the terms of the loan, offering a tangible assurance of the lender's intent to provide financial support.
  2. Basis for Planning: Businesses, in particular, can leverage the Letter of Commitment as a foundation for financial planning, allowing them to make informed decisions based on the assured credit or financing.

Implications for Lenders and Borrowers

  1. Lender Accountability: By issuing a Letter of Commitment, lenders commit to honoring the specified terms, fostering transparency and accountability in their lending practices.
  2. Borrower Responsibility: The borrower, in turn, must adhere to the outlined conditions and fulfill any prerequisites to ensure the commitment's validity.

Navigating Challenges

While the Letter of Commitment solidifies the lending relationship, it also poses challenges. Ambiguities or discrepancies in its language can lead to misunderstandings. Hence, both parties must engage in thorough reviews and seek legal counsel if necessary.

Conclusion

In the intricate dance of financial transactions, the Letter of Commitment emerges as a linchpin, bridging the aspirations of borrowers with the resources of lenders. Its meticulous crafting and comprehensive understanding are essential for fostering a relationship built on trust, transparency, and mutual benefit. Whether you're a business seeking financing or a lender extending credit, recognizing the Letter of Commitment's role can significantly impact the trajectory of financial endeavors.

Article Source Here: Letter of Commitment: What It Is, Purpose, Importance, Examples


source https://harbourfronts.com/letter-of-commitment/

Monday, December 11, 2023

Burn Rate: Definition, Meaning, Types, Examples, Equation, Calculation

Running a successful business requires a healthy cash flow and a positive balance sheet. However, it is common for businesses to experience periods of negative cash flow, where the company's expenses exceed its revenue.

This can be due to various reasons such as seasonal fluctuations, unforeseen expenses, or market changes. And burn rate is the indicator that measures the rate at which a company is burning through its cash reserves.

Understanding and monitoring your burn rate is crucial for the sustainability and growth of your business.

What is the Burn Rate?

The term 'burn rate' is a way to describe how fast a company is using up its cash reserves without making any profits.

This is particularly relevant for new businesses, especially in the tech and life sciences sectors, which are often spending their investment funds to cover operating costs before they start making money.

Essentially, it's a way of keeping track of the money going out of the business each month. These companies may not yet be profitable, and some may not even have any revenue coming in, which makes monitoring the burn rate even more critical.

It's a very common phenomenon in start-ups, where businesses are focused on growth and expansion rather than immediate profitability.

Different Types of Burn Rates

There are two main types of burn rates - Gross and Net.

  1. Gross burn rate: Gross burn rate refers to the total amount of money a company spends each month. It includes all operating expenses, such as employee salaries, office rent, marketing costs, etc.
  2. Net burn rate: Net burn rate takes into account the revenue generated by the company. This is calculated by subtracting the total income from the gross burn rate.

These two types of burn rates provide different perspectives on a company's financial health and can help identify areas where costs can be cut or revenue can be increased.

Calculating Burn Rate With Examples

Each type of burn rate is calculated slightly differently, but both provide valuable insights into a company's financial situation.

  1. Gross Burn Rate

Gross burn rate = Cash/Monthly Operating Expenses

Where,

  • Cash = Total cash reserves available
  • Monthly Operating Expenses = Total amount of money spent each month on operating costs.

For example, if a company has $100,000 in cash reserves and spends $20,000 per month on operating costs, its gross burn rate would be:

$100,000/$20,000 = 5 months

This means that at the current rate of spending, the company's cash reserves will last for 5 months.

  1. Net Burn Rate

Net burn rate = Cash/Monthly Operating Losses

Where,

  • Cash = Total cash reserves available
  • Monthly Operating Losses = Total amount of money spent each month on operating costs minus the total revenue generated.

For example, if a company has $100,000 in cash reserves and spends $20,000 per month on operating costs but generates $10,000 in revenue, its net burn rate would be:

$100,000/($20,000-$10,000) = 10 months

This means that at the current rate of spending and revenue generation, the company's cash reserves will last for 10 months.

Conclusion

Monitoring a company's burn rate is crucial for understanding its financial health and making strategic decisions. By regularly calculating and analyzing both gross and net burn rates, businesses can identify areas where costs can be reduced or revenue can be increased to improve their overall sustainability and growth.

Article Source Here: Burn Rate: Definition, Meaning, Types, Examples, Equation, Calculation


source https://harbourfronts.com/burn-rate/

Sunday, December 10, 2023

Segment Reporting: Definition, Example, Format, Importance

As companies grow, the size of their operations and segments increases. Accounting standards may entail reporting these segments separately. However, the requirements may differ between different accounting frameworks. Segment reporting is a crucial aspect of accounting, especially for larger companies. Therefore, it is critical to discuss it.

What is Segment Reporting?

Segment reporting is a financial practice where companies provide detailed insights into the performance of different aspects of their business, known as segments. These segments could arise from various factors such as product lines, services, geographic regions, or customer types. By breaking down financial information for each segment, companies aim to offer a clearer picture of their overall financial health and performance.

Segment reporting is particularly beneficial for large companies with diverse operations, allowing stakeholders to evaluate individual profitability and the contribution of each segment to the company's overall success. The information disclosed includes revenues, operating income or loss, assets, and other relevant data, providing a comprehensive view for investors, analysts, and decision-makers.

How does Segment Reporting work?

Segment reporting operates as a financial transparency mechanism within companies, breaking financial data down into distinct segments for detailed analysis. The initial step involves the identification of these segments, which can be delineated based on product lines, services, geographic regions, or other criteria deemed essential for strategic decision-making. Subsequently, specific financial details, including revenues, operating income or loss, and asset information, are compiled for each segment.

This tailored information caters to the needs of the Chief Operating Decision-Maker (CODM), guiding resource allocation and strategic decisions. The disclosed segmented financial data is then incorporated into the company's financial statements, offering stakeholders a comprehensive view of individual business areas alongside consolidated financial figures. Additionally, companies may extend segment reporting to geographic regions, providing further insights into the global distribution of their operations.

How is Segment Reporting different under IFRS vs GAAP?

Segment reporting under Generally Accepted Accounting Principles (GAAP) and International Financial Reporting Standards (IFRS) shares common objectives but diverges in specific requirements. GAAP defines operating segments based on factors like product similarities, customer types, and distribution methods, allowing for aggregation if characteristics align.

On the other hand, IFRS does not specify quantitative thresholds but stresses the importance of disclosing regularly reviewed segments, providing more flexibility. It requires the disclosure of segment assets if used by the CODM and allows greater flexibility in allocating certain costs. In contrast to GAAP, IFRS explicitly mandates the separate reporting of geographic segments, necessitating disclosure of revenue from external customers and non-current assets.

Why is Segment Reporting important?

Segment reporting is essential in the financial landscape, providing stakeholders with a comprehensive and detailed understanding of a company's diverse operations. Its significance lies in the ability to evaluate the individual performance of distinct business segments, enabling investors, analysts, and management to discern the contributions of each segment to the company's overall success.

This breakdown of financial information guides strategic decision-making, facilitating efficient resource allocation as companies identify and invest in high-performing segments while addressing challenges in underperforming areas. Moreover, it serves as a vital tool for risk assessment, allowing companies to identify and manage risks associated with specific segments.

Conclusion

Segment reporting allows companies to break their operations down based on various characteristics. This type of reporting may be mandatory under accounting standards for some companies. Segment reporting is crucial for stakeholders. However, the requirements may differ based on the accounting framework in use.

Article Source Here: Segment Reporting: Definition, Example, Format, Importance


source https://harbourfronts.com/segment-reporting/

Saturday, December 9, 2023

Covariance Risk Premium as a Predictor of Market Returns

Various prediction methods are employed in the stock market, leveraging diverse techniques and data sources. Fundamental analysis delves into a company's financial health, examining factors like earnings, assets, and management. Machine learning and artificial intelligence have gained prominence recently, using algorithms to analyze vast datasets and identify patterns elusive to traditional methods. Sentiment analysis gauges market sentiment by examining news articles, social media, and other sources to predict how emotions might influence stock prices. Econometric methods like ARIMA and GARCH add a statistical dimension, employing time-series analysis and volatility modeling to enhance predictions.

Reference [1] introduced a novel prediction method based on a concept called the covariance risk premium (CRP). CRP is defined as the expected physical and risk-neutral covariance of implied volatility changes and market index returns. The authors pointed out,

Through meticulous empirical analysis, we substantiate the predictive power of the CRP, revealing its compelling positive and significant impact on future stock market returns across time horizons spanning from one to 24 months. Our investigation covers the sample period of 1996 to 2019, demonstrating that the CRP’s predictive influence extends beyond the confines of in-sample assessments, thereby showcasing its robustness through out-of-sample tests. Importantly, the CRP’s predictive potential translates into substantial and noteworthy economic gains, offering a lucrative edge for mean-variance investors seeking to optimize their investment strategies. Notably, the resilience of our findings is underscored by their consistent validation across the alternative specification of the CRP.

Overall, this study underscores the pivotal role of the CRP as a potent predictor of stock market returns, fortified by both sound theoretical foundations and empirical validation. The empirical insights emanating from our research serve as a guiding compass for investors aiming to maximize returns.

In short, the paper showed that the CRP can predict well the stock market returns both in- and out-of-sample. Moreover, it performs better than many widely utilized predictors.

Let us know what you think in the comments below or in the discussion forum.

References

[1] Jia, Xiaolan and Ruan, Xinfeng and Zhang, Jin E., Covariance Risk Premium and Expected Stock Returns (October 19, 2020). https://ift.tt/7LRzYwg

Originally Published Here: Covariance Risk Premium as a Predictor of Market Returns


source https://harbourfronts.com/covariance-risk-premium-predictor-market-returns/

Stock Exchange: What It Is, Purpose, Function, Examples

In the bustling arena of finance, the stock exchange stands as a dynamic hub where fortunes are made, companies are valued, and economic landscapes are shaped. This blog post ventures into the heart of the financial world, unraveling the intricate tapestry of the stock exchange – a vital institution that plays a pivotal role in the global economy.

What is a Stock Exchange

At its core, a stock exchange is a marketplace where buyers and sellers convene to trade shares of publicly listed companies. This exchange provides the infrastructure and framework for the buying and selling of stocks, bonds, and other financial instruments. It serves as a conduit for capital to flow between investors and corporations.

Purpose and Function

The primary purpose of a stock exchange is to facilitate the efficient allocation of capital. By connecting companies in need of funding with investors seeking opportunities, the stock exchange allows for the buying and selling of ownership stakes in publicly traded companies. This mechanism not only provides liquidity to investors but also enables companies to raise capital for expansion, research, and other strategic initiatives.

Key Components of a Stock Exchange

  1. Listed Securities: Companies that choose to go public and offer their shares for trading on the exchange become listed securities. These can include stocks, bonds, and other financial instruments.
  2. Brokers and Traders: Individuals and institutions known as brokers and traders engage in buying and selling securities on behalf of investors. They facilitate the transactions on the exchange.
  3. Indices: Stock exchanges often have indices, such as the S&P 500 or FTSE 100, which measure the performance of a specific group of stocks and serve as indicators of market trends.

Examples of Stock Exchanges

  1. New York Stock Exchange (NYSE): Located on Wall Street, the NYSE is one of the world's largest and most iconic stock exchanges.
  2. NASDAQ: Known for its technology-focused listings, NASDAQ is a major U.S. stock exchange that operates electronically.
  3. London Stock Exchange (LSE): The LSE is one of the oldest stock exchanges globally, playing a key role in the international financial landscape.

The Impact on Investors

For investors, the stock exchange offers opportunities for wealth creation and portfolio diversification. It allows individuals to become partial owners of companies they believe in and share in their successes.

Conclusion

The stock exchange is not merely a marketplace; it is a dynamic force that influences economies, shapes industries, and empowers investors. Understanding its mechanisms is essential for anyone looking to navigate the complexities of the financial world. Whether you are an aspiring investor or a seasoned financial professional, the stock exchange remains a fascinating and integral component of the global economic system.

Originally Published Here: Stock Exchange: What It Is, Purpose, Function, Examples


source https://harbourfronts.com/stock-exchange/

Friday, December 8, 2023

Frictional Unemployment: Definition, Formula, Causes, Benefits

When it comes to economics, it's impossible to ignore the impact of unemployment. One particular type of unemployment, often overlooked yet significant, is frictional unemployment.

This idea sheds light on the job market, giving a new understanding of employment dynamics.

It's not about job absence or economic downturn - rather, it's a natural event within any healthy economy. Understanding how it works will help to capture the bigger picture of employment, and contribute to developing effective policies.

What is Frictional Unemployment?

In every thriving economy, there are situations where people quit their jobs to find new ones or fresh graduates actively searching for a job. This naturally creates a state of temporary unemployment, often known as frictional unemployment.

This type of unemployment is considered to be voluntary or transitional and is mostly caused by the time lag between leaving one job and finding another.

This indicates a healthy labor market with fluidity and demand. From an economic perspective, this shows that the economy is growing, and people are exploring better opportunities.

Causes of Frictional Unemployment

The primary cause of frictional unemployment is the transition period between jobs. Other factors that contribute to this type of unemployment include

  1. Change of Location: One of the most common and significant reasons for frictional unemployment is when a person moves to a new location, either voluntarily or due to job requirements. This relocation may lead to a period of searching and waiting for suitable job opportunities in the new area.
  2. Seasonal Jobs: Some industries are affected by seasonal fluctuations, leading to temporary layoffs during slow seasons. Workers in these industries may experience periods of unemployment while waiting for their jobs to resume.
  3. Mismatch of Skills and Job Requirements: It only makes sense that people are more likely to search for jobs that match their skills and qualifications. However, this may lead to a temporary period of unemployment as they wait for the right job opportunity.
  4. Delay in the Hiring Process: There can be many reasons for a delay in the hiring process, such as lengthy recruitment procedures or background checks. These delays may cause frictional unemployment for job seekers who have already left their previous jobs.

Impact of Frictional Unemployment

Frictional unemployment, although temporary, has a significant impact on the economy. It can affect individuals and the overall labor market in several ways.

  1. Individuals: Frictional unemployment can have a negative impact on individuals, causing financial strain and uncertainty. The period of job searching and waiting can be stressful and may lead to a decrease in quality of life.
  2. Employers: Employers also feel the effects of frictional unemployment as they search for qualified candidates to fill vacancies. This process can be time-consuming and costly, leading to a loss of productivity for businesses.
  3. Economy: A certain level of frictional unemployment is considered healthy for the economy as it reflects growth and job mobility. However, if it exceeds a certain point, it can lead to inefficiency in the labor market and slow down economic growth.

Advantages of Frictional Unemployment

Frictional unemployment may seem like a negative aspect of the labor market, but it also has its advantages.

  1. Job Availability: As people find new and better job opportunities, it opens up vacancies for others to fill. This creates a continuous cycle of job availability in the market.
  2. Better Job Matches: Frictional unemployment gives people the opportunity to find jobs that align with their skills, qualifications, and interests. This leads to a more productive workforce and can positively impact overall economic growth.
  3. Economic Growth: As mentioned earlier, a certain level of frictional unemployment is a sign of a healthy economy. It reflects job mobility and growth potential, which can lead to economic expansion.

Conclusion

Frictional unemployment may not receive as much attention as other types of unemployment, but it plays a crucial role in the dynamics of the job market. Understanding how it works can give a better understanding of the overall employment situation and contribute to creating effective policies for a thriving economy.

Post Source Here: Frictional Unemployment: Definition, Formula, Causes, Benefits


source https://harbourfronts.com/frictional-unemployment/

Thursday, December 7, 2023

Subsidiary Ledger: Definition, Meaning, Example, Reconciliation, Advantages

A general ledger is an accounting record summarizing financial transactions for a specific account. However, companies need more information than that provided in this ledger. Therefore, they may use a supplementary record to back it up, known as the subsidiary ledger.

What is a Subsidiary Ledger?

A subsidiary ledger is a supplementary and detailed accounting record that supports a corresponding general ledger account. Its primary function is to provide a more intricate breakdown of the balances in the general ledger, offering a comprehensive view of specific transactions or categories associated with a particular account. They commonly include accounts such as accounts payable, inventory, fixed assets, etc.

For instance, while the general ledger may feature an overarching account for "Accounts Receivable," the subsidiary ledger for accounts receivable would delve into individual customer accounts, delineating transactions, payments, and outstanding balances for a more nuanced financial overview. These subsidiary ledgers enhance the precision and organization of an accounting system by offering detailed insights into specific aspects of a company's financial transactions.

How does a Subsidiary Ledger work?

A subsidiary ledger operates as a supplementary layer within an organization's accounting structure, intricately connected to the general ledger. It is a detailed repository for specific transaction categories, like individual customer accounts or inventory items. Transactions are recorded, encompassing essential details such as dates and amounts.

Periodically, the subsidiary ledger undergoes summarization, and the cumulative totals are integrated into the corresponding general ledger accounts. This synchronized process ensures that the broader financial records accurately encapsulate the nuanced details embedded in the subsidiary ledger. By affording users direct access to detailed transaction information, the subsidiary ledger empowers a more refined analysis of financial data.

Why is the Subsidiary Ledger important?

Subsidiary ledgers offer a multifaceted set of advantages in accounting, starting with their ability to establish detailed recordkeeping. By recording individual transactions within specific categories, these ledgers provide organizations with a comprehensive and granular overview of their financial activities. This intrinsic detail enhances accuracy in financial reporting and streamlines the identification and rectification of errors.

Through efficient analysis, accountants and financial analysts can glean valuable insights, aiding in strategic decision-making and trend identification. The ability to customize reports based on subsidiary ledger data further empowers organizations, offering tailored perspectives on specific accounts or transaction categories and facilitating more nuanced financial planning.

What is the difference between a Subsidiary and a General Ledger?

The general ledger is the primary accounting record, offering a consolidated summary of all financial transactions across various accounts, such as assets, liabilities, equity, revenues, and expenses. It provides a high-level view of the organization's overall financial position and is crucial for external reporting and strategic decision-making. In contrast, a subsidiary ledger is a supplementary set of detailed records supporting specific accounts within the general ledger.

While the general ledger offers a consolidated and comprehensive overview of financial transactions, the subsidiary ledger functions as a detailed companion, breaking down information into specific categories or transactions within individual accounts. The general ledger is instrumental for external reporting and high-level decision-making, whereas subsidiary ledgers provide the necessary for internal management, enabling organizations to delve deeper into specific aspects of financial data.

Conclusion

A subsidiary ledger is an additional accounting record companies maintain that backs general ledgers. This type of ledger is common in areas such as accounts receivable, accounts payable, and inventory. Subsidiary ledgers allow companies to keep detailed financial information that the general ledger does not include.

Article Source Here: Subsidiary Ledger: Definition, Meaning, Example, Reconciliation, Advantages


source https://harbourfronts.com/subsidiary-ledger/

How Hedging Frequency and Volatility Affect Profit and Loss

Delta hedging is a risk management strategy widely used in financial markets, particularly in options trading. The primary objective of delta hedging is to offset or neutralize the directional risk, or delta exposure, associated with an options position.

Delta represents the sensitivity of an option's price to changes in the price of the underlying asset. To implement delta hedging, traders adjust their positions in the underlying asset (stocks, for example) to counterbalance the delta of the options they hold. If a trader is long an option with a delta of 0.6, indicating sensitivity to price changes, they might sell or short 60 shares of the underlying asset to create a delta-neutral portfolio. This dynamic strategy helps traders manage risk by mitigating potential losses due to changes in the underlying asset's price, creating a more stable and predictable portfolio.

When delta hedging, a crucial question arises: how often should we hedge, and what volatility should be used to calculate the delta? Reference [1] investigates this question within the context of the oil market. The author pointed out,

It is not surprising that with less frequent hedging, the risks measured by the annualized standard deviation of the portfolio’s P&L steadily increase. More interesting is the observation that annualized profits also increase slightly if the portfolio does not rebalance the delta for at least two days. This confirms that some additional gains can indeed be captured from short-term price reversals by leaving the portfolio unhedged for a few days. If instead of hedging every day, the trader hedges only every two or three days, then higher profitability adequately compensates for taking larger risks while simultaneously saving on transaction costs. However, leaving the strategy unhedged for more than a week makes it less attractive on a risk-adjusted basis. While such a strategy allows traders to benefit from short-term price reversals, it can suffer significant losses if the portfolio is left unhedged for too long.

The findings are consistent with our intuitions: hedging less frequently increases PnL variance but decreases costs. However, there's an interesting finding: hedging more frequently doesn't yield the highest expected return. In other words, there exists an optimal hedging frequency that maximizes the expected return.

The author also explores different hedging volatilities,

To illustrate VRP sensitivity to the choice of the hedging delta, we scale the hedging volatility by multiples of 0.5, 0.75, 1.25, and 1.5 of the prevalent implied volatility. The multiple of 1.0 represents the base case. The results of this experiment are summarized in Fig. 9.10.

The most interesting takeaway from this analysis is P&L improvement from hedging with low volatility and P&L decline for hedging with high volatility.

In short, there's no need to hedge using implied volatility. Opting for lower volatility in hedging results in a higher expected return.

These findings are insightful. It's important to note, however, that they specifically pertain to short gamma positions. If you’re long gamma, the conclusions might vary.

Let us know what you think in the comments below or in the discussion forum.

References

[1] Bouchouev, I. (2023). The Art and Science of Delta Hedging. In: Virtual Barrels. Springer Texts in Business and Economics. Springer, Cham, pg. 202

Originally Published Here: How Hedging Frequency and Volatility Affect Profit and Loss


source https://harbourfronts.com/hedging-frequency-volatility-affect-profit-loss/

Monday, December 4, 2023

Different Types of Customers

Understanding the various types of customers is paramount in the contemporary business landscape as it enables companies to tailor their approaches and services, fostering stronger relationships and enhancing customer satisfaction. Each customer type comes with unique expectations, preferences, and behaviors that, when recognized and addressed, can guide businesses in optimizing their marketing strategies, communication methods, and product offerings. This nuanced understanding empowers companies to create personalized experiences, meet diverse needs, and ultimately build lasting customer loyalty.

In a competitive market where customer expectations continue to evolve, businesses that grasp the intricacies of their customer base can adapt more effectively, stay ahead of trends, and position themselves for sustained success. This blog post explores the fascinating array of customer types, shedding light on their characteristics and implications for businesses.

1. Loyal Customers

Loyal customers are the bedrock of business success. These individuals consistently choose a particular brand or company, often due to positive past experiences, brand affinity, or loyalty programs. Building and maintaining relationships with loyal customers is crucial for fostering brand advocacy and repeat business.

2. Impulse Buyers

Impulse buyers make purchasing decisions spontaneously, often driven by emotions, promotions, or the thrill of the moment. Understanding the psychology behind impulse buying can help businesses optimize their marketing strategies to capture these fleeting opportunities.

3. Bargain Hunters

Bargain hunters are always on the lookout for the best deals, discounts, and value for money. Price-sensitive, they are swayed by promotions and sales. Catering to this segment requires businesses to strategically price products, offer promotions, and communicate value propositions effectively.

4. Window Shoppers

Window shoppers browse without immediate intent to buy. While they may not convert into customers during every visit, providing a positive shopping experience and creating brand awareness can influence their future purchasing decisions.

5. Demanding Customers

Demanding customers have high expectations and specific requirements. They seek personalized experiences, prompt customer service, and top-notch product quality. Meeting the demands of this customer segment is a challenge but can lead to strong brand loyalty if executed effectively.

6. New Customers

New customers represent untapped potential for businesses. Capturing their attention through effective marketing, onboarding processes, and first impressions is crucial to converting them into repeat customers.

7. Tech-Savvy Customers

In the digital age, a significant segment of customers is tech-savvy. They prefer online shopping, utilize mobile apps, and engage with brands on social media. Businesses need to have a robust online presence and user-friendly technology to cater to this customer type.

Conclusion

In the kaleidoscope of customer diversity, recognizing the different types is not just an exercise in segmentation but a strategic necessity. Tailoring marketing approaches, customer service, and overall business strategies to accommodate the preferences and behaviors of these diverse customer types can lead to enhanced customer satisfaction, loyalty, and sustainable business growth. As businesses continue to evolve, understanding and adapting to the ever-changing landscape of customer diversity remains a dynamic and essential aspect of success.

Originally Published Here: Different Types of Customers


source https://harbourfronts.com/types-of-customers/