Volatility trading strategies
In previous posts, we presented 2 volatility trading strategies: one strategy is based on the volatility risk premium (VRP) and the other on the volatility term structure, or roll yield (RY). In this post we present a detailed comparison of these 2 strategies and analyze their recent performance.
The first strategy (VRP) is based on the volatility risk premium. The trading rules are as follows [1]:
Buy (or Cover) VXX if VIX index <= 5D average of 10D HV of SP500
Sell (or Short) VXX if VIX index > 5D average of 10D HV of SP500
Buy (or Cover) VXX if 5-Day Moving Average of VIX/VXV >=1 (i.e. backwardation)
Sell (or Short) VXX if 5-Day Moving Average of VIX/VXV < 1 (i.e. contango)
| RY | VRP | |||
| Initial capital | 10000 | 10000 | ||
| Ending capital | 179297.46 | 323309.02 | ||
| Net Profit | 169297.46 | 313309.02 | ||
| Net Profit % | 1692.97% | 3133.09% | ||
| Exposure % | 99.47% | 99.19% | ||
| Net Risk Adjusted Return % | 1702.07% | 3158.54% | ||
| Annual Return % | 44.22% | 55.43% | ||
| Risk Adjusted Return % | 44.46% | 55.88% | ||
| Max. system % drawdown | -50.07% | -79.47% | ||
| Number of trades trades | 32 | 55 | ||
| Winners | 15 (46.88 %) | 38 (69.09 %) |
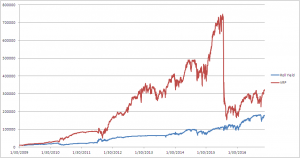
We observe that RY produced less trades, has a lower annualized return, but less drawdown than VRP. The graph below depicts the portfolio equities for the 2 strategies.

It is seen from the graph that VRP suffered a big loss during the selloff of Aug 2015, while RY performed much better. In the next section we will investigate the reasons behind the drawdown.
Performance during August 2015
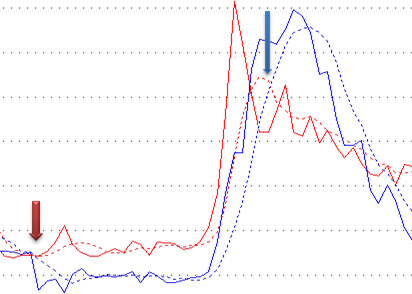
The graph below depicts the 10-day HV of SP500 (blue solid line), its 5-day moving average (blue dashed line), the VIX index (red solid line) and its 5-day moving average (red dashed line) during July and August 2015. As we can see, an entry signal to go short was generated on July 21 (red arrow). The trade stayed short until an exit signal was triggered on Aug 31 (blue arrow). The system exited the trade with a large loss.

The reason why the system stayed in the trade while SP500 was going down is that during that period, the VIX was always higher than 5D MA of 10D HV. This means that 10D HV was not a good approximate for the actual volatility during this highly volatile period. Recall that the expectation value of the future realized volatility is not observable. This drawdown provides a clear example that estimating actual volatility is not a trivial task.
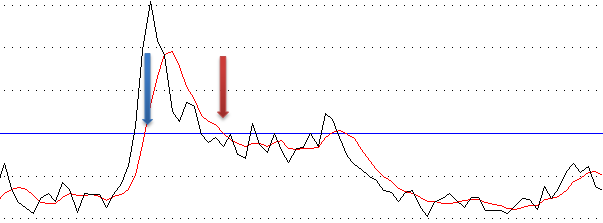
By contrast, the RY strategy was more responsive to the change in market condition. It went long during the Aug selloff (blue arrow in the graph below) and exited the trade with a gain. The responsiveness is due to the fact that both VIX and VXV used to generate trading signals are observable. The graph below shows VIX/VXV ratio (black line) and its 5D moving average (red line).

In summary, we prefer the RY strategy because of its responsiveness and lower drawdown. Both variables used in this strategy are observable. The VRP, despite being based on a good ground, suffers from a drawback that one of its variables is not observable. To improve it, one should come up with a better estimate for the expectation value of the future realized volatility. This task is, however, not trivial.
References
[1] T Cooper, Easy Volatility Investing, SSRN, 2013
Article source here: Volatility Trading Strategies, a Comparison of Volatility Risk Premium and Roll Yield Strategies

No comments:
Post a Comment