What is a Monte Carlo Simulation?
A Monte Carlo simulation refers to a technique used in financial modeling to determine the probability of various outcomes in a process or problem that is not easily predictable or solvable. The reason behind the difficulty of the process or problem is the existence of random variables. A Monte Carlo Simulation produces a simulation based on random samples to achieve numerical results.
While there are various ways to perform Monte Carlo simulations, the easiest way is through Excel. There are various built-in tools in Excel that help with the simulation. The most common tool used in this regard is the "What-If Analysis" tool.
Monte Carlo Simulation in Excel
A company wants to calculate its profits for a project based on estimations. However, there is some uncertainty around the estimates. Therefore, the company performs Monte Carlo simulations. It has the following information available.
|
Sales |
Cost of Sales |
Fixed costs |
|
|
Expected |
1,000,000 |
350,000 |
500,000 |
|
Standard Deviation |
80,000 |
25,000 |
120,000 |
The company assumes there is a normal distribution around these inputs. Therefore, it can perform the simulation using Excel. The first step to perform Monte Carlo simulations is to calculate the normal distribution for the figures above. The company may use the following formula to calculate a normal distribution for all these.
NORM.INV(probability, mean, standard deviation)
For the first parameter, the company uses a random probability using the ‘rand()' function. For the mean parameter, the company uses the expected results. Based on these, the company gets the following outputs.
|
Sales |
Cost of Sales |
Fixed costs |
|
|
Expected |
1,000,000 |
350,000 |
500,000 |
|
Standard Deviation |
80,000 |
25,000 |
120,000 |
|
First simulation |
978,986 |
385,896 |
251,134 |
The company's expected profits, based on the first simulation, will be $341,956.
The next step the company takes is to make a table for the number of simulations it wants to make. For this purpose, the company wants to generate 30 simulations.
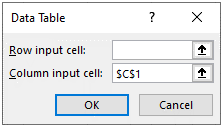
Once it creates a table for the 30 simulations, the company links the profits to the table, from the first simulation. For the other 29 simulations, it uses the What-if Analysis Data Table feature. The tool needs at least one input cell for random calculations. However, the cell should be a cell outside the table. Here's how it looks.

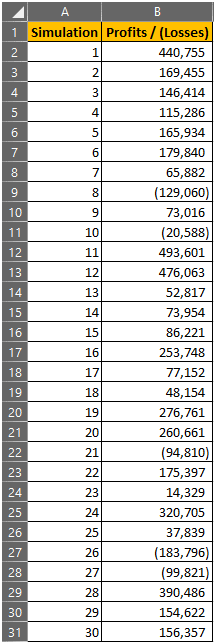
Based on the calculation, it produces the following table.

Based on these simulations, the company performs several other calculations, such as calculating the mean value, which comes to $139,246. The formula it uses is “=AVERAGE(B2:B31)". Similarly, the company measures the standard deviation for the simulations using the formula "=STDEV(B2:B31)”, which comes to $171,670.
Therefore, using excel can help in performing Monte Carlo simulations when there is uncertainty involved in variables. While the above example considers only 30 simulations, users can choose to generate even more simulations based on their needs.
Similarly, the company used the simulation to calculate the average and standard deviation of the outcomes. However, users may use the simulation in more complex ways than that above.
Conclusion
Monte Carlo simulation is a technique used to determine the probability of various outcomes for complex processes in the presence of random variables. While several tools can perform simulations, the most commonly used one is Excel. The Excel feature that helps with Monte Carlo simulations is the What-if Analysis Data Table tool combined with the “NORM.INV” formula.
Article Source Here: Monte Carlo Simulation in Excel

No comments:
Post a Comment