
In the previous post, we introduced the Parkinson volatility estimator that takes into account the high and low prices of a stock. In this follow-up post, we present the Garman-Klass volatility estimator that uses not only the high and low but also the opening and closing prices.
Garman-Klass (GK) volatility estimator consists of using the returns of the open, high, low, and closing prices in its calculation. It is calculated as follow,
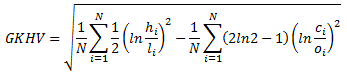
where hi denotes the daily high price, li is the daily low price, ci is the daily closing price and oi is the daily opening price.
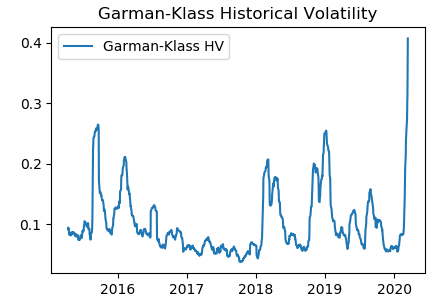
We implemented the above equation in Python. We downloaded SPY data from Yahoo finance and calculated GK historical volatility using the Python program. The picture below shows the GK historical volatility of SPY from March 2015 to March 2020.
The GK volatility estimator has the following characteristics [1]
Advantages
- It is up to eight times more efficient than the close-to-close estimator
- It makes the best use of the commonly available price information
Disadvantages
- It is even more biased than the Parkinson estimator
Follow the link below to download the Python program.
References
[1] E. Sinclair, Volatility Trading, John Wiley & Sons, 2008
Originally Published Here: Garman-Klass Volatility Calculation – Volatility Analysis in Python
No comments:
Post a Comment