Wednesday, June 7, 2023

Momentum in the Option Market, Part 2

Momentum is a widely observed phenomenon in the stock market that refers to the tendency of stocks that have exhibited strong price performance in the past to continue performing well in the future, and vice versa. The momentum effect suggests that stocks experiencing upward price trends tend to attract further buying interest, leading to additional price increases, while stocks on a downward trend tend to experience continued selling pressure, resulting in further price declines. This phenomenon is often attributed to various factors, including investor psychology, market trends, and herding behavior.

Momentum is not limited to the equity market alone; it also manifests in the option market. As we have previously discussed, delta-hedged straddle option positions have shown evidence of exhibiting momentum. Recently, in Reference [1], further research has delved into exploring momentum within the option market by extending the analysis to include option factors. The authors pointed out,

In this paper, we extend tests for factor momentum to the options markets, relying on a novel set of 56 factors based on sorts of daily delta-hedged call options. We find corroborating evidence for both the existence of factor momentum and its explanatory power for momentum in the factors’ underlying assets: First, time-series and cross-sectional factor momentum strategies are profitable. Their returns are distinct from returns of an equally-weighted factor portfolio and robust to the factor model of Horenstein et al. (2020). Second, strategies relying on a one-month formation period are largely driven by factor autocorrelation. However, the longer the formation period, the more important are high mean factor returns and their persistent variation as momentum drivers. Third, as in Ehsani & Linnainmaa (2022) and Arnott et al. (2023), momentum effects are the strongest in the option factors’ largest eigenvalue principal components. Fourth, and extending the findings in Heston et al. (2022) to single option returns, we find momentum at the option level. Spanning tests suggest that option factor momentum subsumes option momentum and not vice versa.

This study presents additional insights into how momentum can influence options. By understanding and harnessing momentum in the option market, investors can potentially enhance their trading strategies and optimize their risk-return profiles.

Let us know what you think in the comments below or in the discussion forum.

References

[1] Käfer, Niclas and Moerke, Mathis and Wiest, Tobias, Option Factor Momentum (2023), https://ift.tt/WTzHE7w

Post Source Here: Momentum in the Option Market, Part 2


source https://harbourfronts.com/momentum-in-the-option-market-part-2/

Tuesday, June 6, 2023

Pro Forma Income Statement: Template in Excel, Definition, vs Regular Income Statement, Format

An income statement is a financial statement that shows a company's revenues, expenses, gains, and losses over a specific period. It reflects the company's ability to generate profits by comparing revenues with expenses. Similarly, it helps evaluate profitability, cost management, and overall financial performance by revealing the net profit or loss from core business activities and other related income and expenses.

The income statement reflects a company’s financial performance for the last financial period. Companies may also prepare a pro forma income statement to predict future revenues and expenses. However, its format may differ from one company to another based on their needs.

What is a Pro Forma Income Statement?

A pro forma income statement is a financial statement that provides a projected or estimated view of a company's expected revenues, expenses, gains, and losses for a future period. It is prepared based on assumptions and hypothetical scenarios to forecast financial performance. The pro forma income statement typically includes projected revenues from sales, services, or other sources.

Pro forma income statements are crucial for businesses when planning for future operations, making strategic decisions, or seeking financing. They allow stakeholders to evaluate the potential financial impact of various scenarios, assess profitability, and gauge the feasibility of business plans or investments. It serves as a tool for analysis and decision-making, providing a projected financial picture for planning and evaluation purposes.

What's the difference between Pro Forma and a Regular Income Statement?

A regular income statement, also known as a historical income statement, presents the revenues, expenses, gains, and losses incurred by a company during a specific period. It provides a retrospective view of the company's financial performance and reflects the results based on past transactions and events. The regular income statement provides a historical record.

On the other hand, a pro forma income statement is a projected or forecasted financial statement that outlines the expected revenues, expenses, gains, and losses for a future period. It illustrates the potential financial outcomes of specific events, changes in business operations, or strategic decisions. While a regular income statement shows the actual financial performance, a pro forma income statement focuses on anticipated or hypothetical scenarios.

What is the format for Pro Forma Income Statement?

The pro forma income statement does not have a specific format. Companies can prepare this statement in any template. Primarily, it uses the same format as a regular income statement with projections for future performance. Nonetheless, below is an example of how the pro forma income statement may look.

[caption id="attachment_9535" align="aligncenter" width="971"]pro forma income statement template in excel 
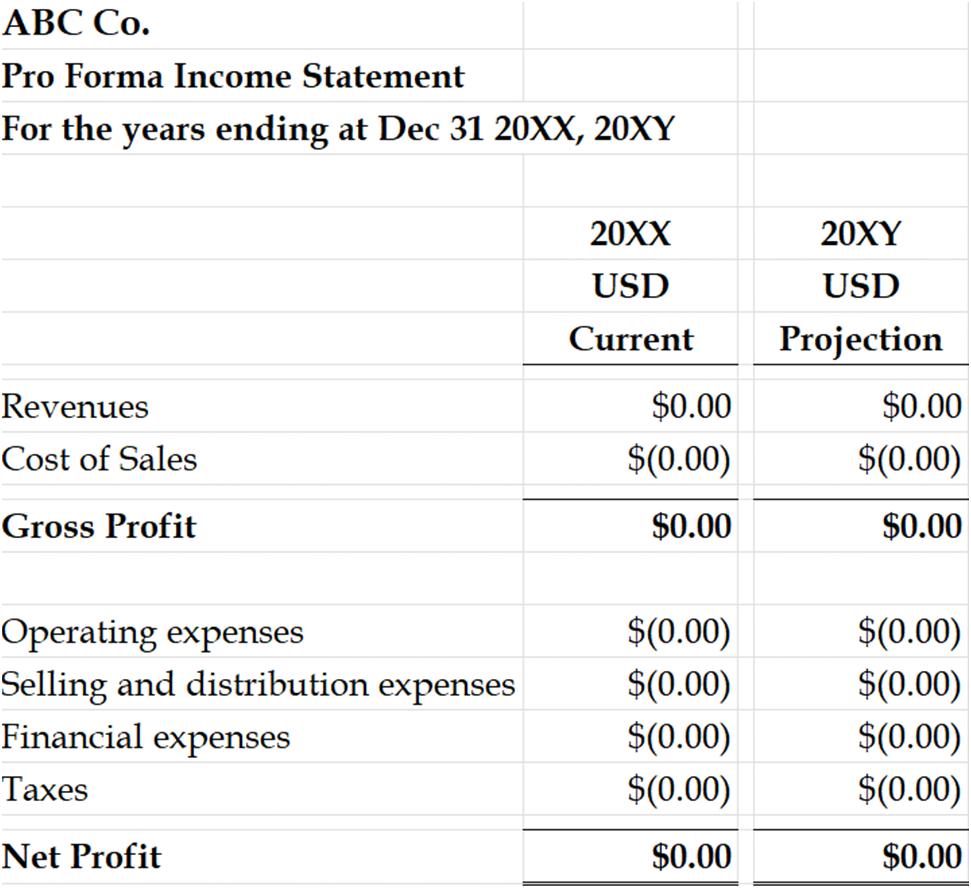
Pro forma income statement template in Excel[/caption]

The above pro forma income statement includes the current year (20XX) for the company ABC Co. Based on that, it also projects for 20XY. Usually, companies use the current year as a base to project the financial performance for the future. Companies can expand this format by including more years or line items as required.

Conclusion

The pro forma income statement projects a company's financial performance for the future. It uses estimates and predictions based on expected events or circumstances. Usually, companies use it to budget for the future or forecast their performance for future periods. It differs from the regular income statement as the pro forma focuses on the future, while the former includes historical figures.

Originally Published Here: Pro Forma Income Statement: Template in Excel, Definition, vs Regular Income Statement, Format


source https://harbourfronts.com/pro-forma-income-statement/

Monday, June 5, 2023

How to Calculate Overtime For Semi Monthly Payroll

For many employers, semi-monthly payroll is an efficient method for paying their employees. However, calculating overtime pay under this method can be complex. It's essential to get the calculations right to avoid legal issues and ensure employees are paid fairly.

However, it's not that difficult once it's understood - it's a simple method of calculating the overtime rate for a semi-monthly payroll.

What is Semi Monthly Payroll?

Semi-monthly payroll is a payment method where employees are paid twice a month, on the 15th and last day of the month.

It's different from biweekly payroll where employees are paid every two weeks. With semi-monthly payroll, an employee receives two payments in a single month, covering different time periods.

So in simple words, employees are receiving 24 paychecks a year in semi-monthly payroll, compared to 26 paychecks if they were on a biweekly system.

Calculating overtime pay under this system is slightly more complex than other payroll methods - however, if done properly, employers can ensure they are meeting all legal requirements.

How to Calculate Overtime for Semi-Monthly Payroll

There are a few things that are needed to be considered to accurately calculate the overtime rate for a semi-monthly payroll

  1. Determine the workweeks in a pay period: The first step is to determine the number of workweeks in a pay period. In semi-monthly payroll, there will be two pay periods in a month. In each period, the number of workweeks will vary depending on the calendar.
  2. Determine the number of hours in each workweek: Once you have determined the number of workweeks in a pay period, you need to determine how many hours are workable in each week. The Department of Labor (DOL) requires that employees be paid overtime for any hours worked over 40 hours in one workweek.
  3. Calculate the regular rate for the period: The next step is to calculate the regular rate for the entire pay period. This can be done by dividing the total amount of wages (including overtime) earned in that period by the total number of hours worked.
  4. Calculate the overtime rate for each hour worked over 40 hours: Finally, you must calculate the overtime rate for each hour worked over 40 hours in a workweek. This can be done by multiplying the regular rate by 1.5 (the DOL's overtime multiplier).

Example of Calculating Overtime For Semi Monthly Payroll

Let's take a look at a scenario of company ABC which has a semi-monthly payroll system. In a certain month, the employees worked 7 workweeks with 40 hours in each week - and the pay period will be 1st April to 15th April. Also, let's say they are getting paid $20/hour

1st Workweek (1st April to 7th April)

For the first work week the employee, let's say, has worked for 46 hours. Meaning, the employee has worked 6 overtime hours.

The regular rate for the week: (40 hours x $20/hour) = $800

The overtime rate for the 6 hours: ($20 x 1.5) = $30/hour

So he will be getting paid (6 hours x $30/hour) + $880 = $960.

2nd Workweek (8th April to 15th April)

For the second work week, the employee worked for 44 hours. Meaning, they have worked 4 overtime hours.

The regular rate for the week: (40 hours x $20/hour) = $800

The overtime rate for the 4 hours: ($20 x 1.5) = $30/hour

So he will be getting paid (4 hours x $30/hour) + $800 = $920.

Total wages for the pay period

The total salary earned in this period is ($960 + $920) = $1880.

Conclusion

Calculating the overtime rate for semi-monthly payroll may seem complicated and confusing. But to be compliant and ensure employees are paid correctly, it is important that employers understand the process of calculating overtime for this type of payroll system. To make sure the calculations are accurate, employers should consult with an accountant or payroll expert.

Originally Published Here: How to Calculate Overtime For Semi Monthly Payroll


source https://harbourfronts.com/how-to-calculate-overtime-for-semi-monthly-payroll/

Sunday, June 4, 2023

Personal Balance Sheet: Example, Template, Definition, Format in Excel, Sample

What is a Personal Balance Sheet?

A personal balance sheet is a financial statement that provides a snapshot of an individual's financial situation by presenting their assets, liabilities, and net worth at a specific point in time. It provides a comprehensive overview of what a person owns and owes and their financial standing. Primarily, it follows the same format and principles as a business balance sheet.

A personal balance sheet provides individuals with a clear picture of their monetary resources, debts, and net worth. It is an essential tool for assessing financial progress, planning future goals, making informed financial decisions, and tracking changes in personal wealth over time. However, it doesn't follow specific accounting standards applicable to businesses and companies.

What does a Personal Balance Sheet include?

A personal balance sheet includes the same components that are a part of the typical one. As mentioned above, these consist of assets, liabilities, and net worth (or equity). For individuals, the definition or elements may differ as below.

Assets

Assets for individuals include items of value that they own. They can encompass various categories, such as the following.

  • Cash and cash equivalents: Money held in checking and savings accounts or cash on hand.
  • Investments: Stocks, bonds, mutual funds, real estate properties, or other investment holdings.
  • Property: The value of real estate, vehicles, or any other tangible assets.
  • Personal possessions: Valuable items like jewelry, artwork, collectibles, or other valuable assets.

Liabilities

Liabilities for individuals represent the debts or financial obligations they have accumulated in the past. These can include the following.

  • Loans: Outstanding balances on mortgages, car loans, student loans, personal loans, or any other borrowed funds.
  • Credit card debt: Unpaid balances on credit cards or lines of credit.
  • Other debts: Unpaid medical bills, taxes owed, or any other financial obligations.

Net worth

Net worth is similar to shareholders' or owners' equity. Individuals can calculate it by subtracting the total liabilities from the total assets. It represents the individual's overall financial position and indicates wealth or financial standing. A positive net worth suggests that assets exceed liabilities, while a negative net worth indicates the opposite.

What is the Personal Balance Sheet format?

The personal balance sheet does not have a specific format. Individuals may use any template they want. However, it must follow the principle that the net worth represents the difference between assets and liabilities. An example of the personal balance sheet format is as below.

[caption id="attachment_9524" align="aligncenter" width="971"] personal balance sheet example, template, format 
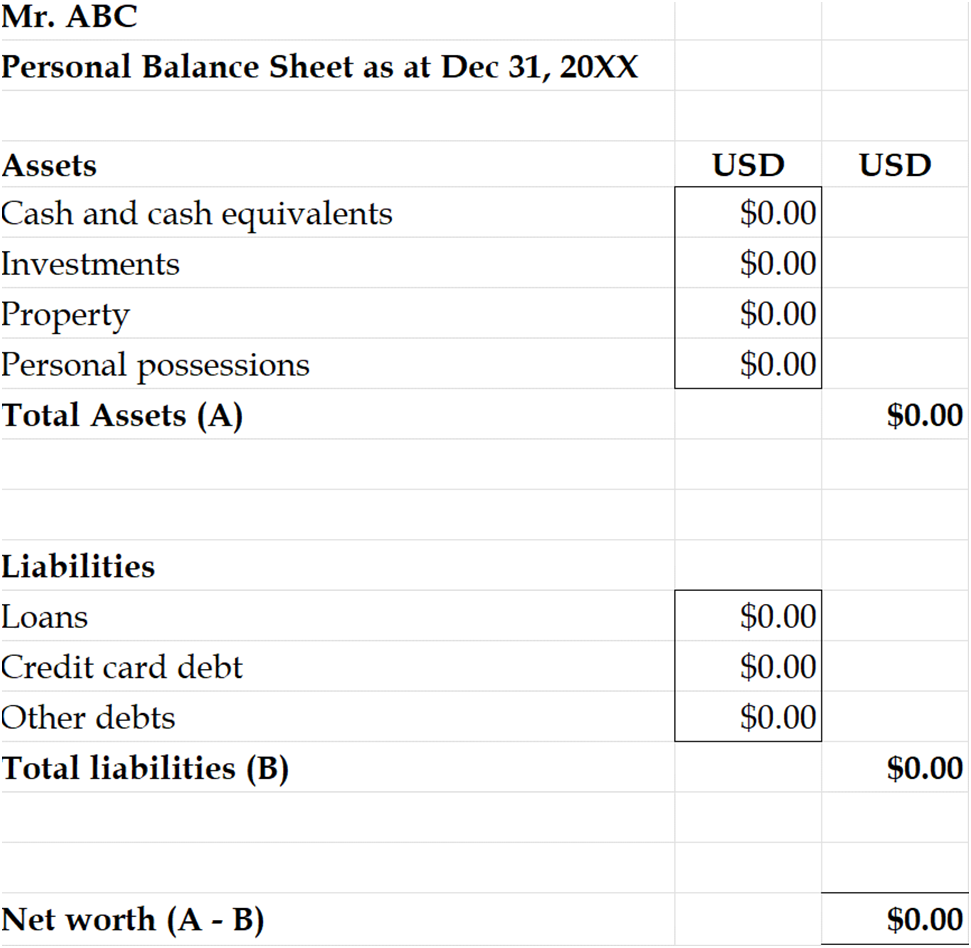
A personal balance sheet example, template in Excel[/caption]

Why should individuals prepare a Personal Balance Sheet?

Preparing a personal balance sheet is critical for individuals as it provides a comprehensive assessment of their financial situation. It allows individuals to evaluate their assets, liabilities, and net worth, enabling them to understand their financial health. With a personal balance sheet, individuals can set financial goals, create effective budgeting strategies, and manage their debts more efficiently.

Furthermore, a personal balance sheet provides transparency and documentation of an individual's financial position. By regularly updating and reviewing their personal balance sheet, individuals can make adjustments, optimize their asset management, and ensure they are on track to meet their financial objectives.

Conclusion

A personal balance sheet shows an individual's financial health and position at a specific date. It includes assets, liabilities, and equity, shown as net worth. Primarily, this balance sheet shows how much an individual is worth based on the difference between his assets and liabilities. However, it does not follow a specific format or template.

Article Source Here: Personal Balance Sheet: Example, Template, Definition, Format in Excel, Sample


source https://harbourfronts.com/personal-balance-sheet-example-template-definition-format-excel-sample/

Saturday, June 3, 2023

Revised Depreciation: Formula, Definition, Method, Equation

Depreciation refers to the systematic allocation of the cost of a tangible asset over its estimated useful life. It is an accounting method used to recognize and distribute the expense of a resource over time. Depreciation helps match the asset's cost with the revenue it generates and considers factors such as wear and tear, obsolescence, and age.

Companies can use several methods to calculate depreciation. However, it may require some adjustments due to various factors. The recalculated amount becomes revised depreciation.

What is Revised Depreciation?

Revised depreciation involves modifying the depreciation method, useful life, residual value, or other factors associated with calculating asset depreciation. The purpose of revised depreciation is to ensure that the recorded depreciation expense aligns more accurately with the current value and expected future usefulness of the asset. Sometimes, accounting terms may also refer to it as adjusted depreciation.

When circumstances surrounding an asset change significantly, such as changes in usage patterns, market conditions, or technological advancements, it may be necessary to revise the initial depreciation calculations. By doing so, the company can provide more reliable financial reporting that reflects the asset's true economic benefits over time. The actual amount depreciated on the income statement equals the revised depreciation.

How does Revised Depreciation work?

Revised depreciation works by modifying the initial depreciation calculations for an asset to better reflect its current value and expected future usefulness. The process involves assessing the need for revision based on significant changes in circumstances, such as market conditions or technology advancements. Companies gather relevant information to support this revision and review accounting policies to ensure compliance.

Then, the depreciation parameters, including the depreciation method, useful life, or residual value, get adjusted based on the assessment. The revised depreciation then gets implemented prospectively, starting from the revision date, and disclosed in the company's financial statements. Ongoing monitoring ensures the continued accuracy and relevance of the revised depreciation. The objective is to provide more accurate financial reporting that matches the asset's cost with its actual consumption over time.

What are the factors that impact Revised Depreciation?

Several factors may require companies to revise their depreciation calculation. Some of the primary ones include the following.

Technological advancements

Advances in technology can render an asset obsolete or reduce its useful life. If significant technological changes affect the asset's value or usage, a revision of depreciation may become necessary.

Changes in market conditions

Shifts in market demand, competition, or industry trends can impact an asset's value or expected future benefits. If market conditions change substantially, it may be necessary to revise the depreciation estimates.

Physical wear and tear

Over time, an asset may experience greater or lesser wear and tear than initially anticipated. If the actual wear and tear deviate significantly from the original estimates, a revision of depreciation may be appropriate to reflect the asset's condition more accurately. Sometimes, companies may also impair the asset rather than change depreciation factors.

Changes in regulations or laws

Alterations in regulations or laws related to the asset, such as environmental standards or usage restrictions, may affect its useful life or value. Revised depreciation can help align the asset's depreciation calculations with the updated regulatory requirements.

Conclusion

Depreciation is the allocation of an asset's cost over its useful life. Companies use several factors and methods when calculating the amount. However, they may change these for revised depreciation. Essentially, it involves adjusting depreciation factors due to various reasons. Revised depreciation is essential to accurate financial reporting.

Post Source Here: Revised Depreciation: Formula, Definition, Method, Equation


source https://harbourfronts.com/revised-depreciation/

Friday, June 2, 2023

Exponential Depreciation: Definition, Formula, Calculation, Example, Equation, Meaning

Manufacturing and construction companies typically use the exponential depreciation formula when calculating the depreciation of their fixed assets.

For companies that make long-term investments in large equipment and machinery, it's important to use a formula that considers how the value of the asset decreases with time.

This way they can get an idea of what their assets will be worth in the future.

What is Exponential Depreciation?

Exponential depreciation is a term used to describe a quantity that initially decreases slowly but then rapidly. This means that the depreciation of an asset will initially be slow, but as time passes, it will become faster as the value decreases.

This phenomenon mostly occurs in the first few years of an asset's life, but as time passes, it will become less and less relevant. In simple words, exponential depreciation is the rate at which an asset loses its value over time.

How Exponential Depreciation Works

As mentioned, exponential depreciation is a term used to describe the gradual decline of a quantity over time, where the rate of decline becomes faster as time goes on.

According to the exponential decay formula - it takes into account the initial value of the quantity, the rate of decay or depreciation, and the amount of time that has passed.

Understanding how exponential depreciation is valuable in several fields, such as finance, economics, and business, can help both people and businesses in making informed decisions about investments and asset management.

Individuals can make more informed financial decisions for the future by calculating the rate of depreciation and monitoring how it evolves.

Calculating The Exponential Depreciation

The general formula for calculating the exponential depreciation of an asset is as follows

f(x) = a (1 - r)^x

Where

f (x) = Exponential Growth Function

a = Initial Amount

1-r = Decay Factor

x= Time Period

Examples of The Exponential Depreciation

Suppose a company purchases a piece of machinery for $50,000. The machinery is expected to have a useful life of 8 years, at which point it will need to be replaced.

The company estimates that the machinery will depreciate at a rate of 15% per year using the exponential decay formula. To calculate the depreciation after 4 years, we can use the formula

f(x) = a (1 - r)^x

Where

a = $50,000 (initial amount)

r = 0.15 (decay factor)

x = 4 (time period)

Plugging in the values

f(4) = $50,000 (1 - 0.15)^4

f(4) = $50,000 (0.657)

f(4) = $32,850

Therefore, after 4 years, the machinery will have depreciated by approximately $17,150 ($50,000 - $32,850).

Conclusion

Companies need to understand the exponential depreciation formula. This will help them decide if it is a good idea to invest in something. The formula can tell them how quickly their investment will become worth less over time. They can also use this formula to plan their money for the future.

Article Source Here: Exponential Depreciation: Definition, Formula, Calculation, Example, Equation, Meaning


source https://harbourfronts.com/exponential-depreciation/

Are Expenses Liabilities? What Are the Differences?

In the realm of accounting, it is crucial to distinguish between expenses and liabilities, as both terms play distinct roles in financial reporting. Expenses and liabilities are fundamental concepts that reflect different aspects of a company's financial position. In this blog post, we will delve into the differences between expenses and liabilities, clarifying their definitions and their significance in financial accounting.

What are Expenses?

Expenses in accounting refer to the costs incurred by a business during its regular operations in order to generate revenue. These costs can include various expenditures, such as salaries, rent, utilities, raw materials, marketing expenses, and other day-to-day operational costs. Expenses are typically categorized and reported on the income statement, which provides an overview of a company's revenues, expenses, and resulting net income or net loss for a given period.

What are Liabilities?

On the other hand, liabilities represent the obligations or debts owed by a company to external parties. Liabilities arise from past transactions or events and are classified on the balance sheet, a financial statement that showcases a company's assets, liabilities, and shareholders' equity. Examples of liabilities include accounts payable, loans, accrued expenses, taxes payable, and other outstanding obligations.

Differences Between Expenses and Liabilities

While expenses and liabilities are both elements of a company's financial position, they are distinct in their nature and treatment:

Timing of Recognition: Expenses are recognized when they are incurred in the process of generating revenue. They are recorded on the income statement and directly impact the calculation of net income. Liabilities, on the other hand, represent obligations that are yet to be settled. They are recorded on the balance sheet as an indication of future payment obligations.

Relationship to Revenue: Expenses are closely tied to the revenue-generating activities of a company. They are incurred to support and facilitate the generation of revenue. In contrast, liabilities do not have a direct relationship with revenue. They represent financial obligations that need to be fulfilled, regardless of the revenue generated.

Settlement: Expenses are generally settled through cash or other assets, reducing the company's resources. Once an expense is recognized, it is no longer a future obligation. Liabilities, however, represent outstanding obligations that are yet to be settled, and their settlement may involve the transfer of assets, cash, or services in the future.

Conclusion

In summary, expenses and liabilities are distinct concepts in accounting that represent different aspects of a company's financial position. Expenses reflect the costs incurred in the process of generating revenue and are recognized on the income statement. Liabilities, on the other hand, represent the outstanding obligations or debts owed by a company and are recorded on the balance sheet. Understanding the difference between expenses and liabilities is crucial for accurate financial reporting and analysis. By correctly categorizing and reporting these items, businesses can provide transparent and reliable information about their financial performance and obligations, aiding in effective decision-making and financial management.

Article Source Here: Are Expenses Liabilities? What Are the Differences?


source https://harbourfronts.com/are-expenses-liabilities/

Thursday, June 1, 2023

How to Balance a Balance Sheet

A balance sheet is a financial statement that presents a snapshot of a company's financial position at a specific moment. It has three main components: assets, liabilities, and shareholders' equity. Assets represent what the company owns, liabilities represent its obligations, and shareholders' equity represents the residual interest of shareholders in the company's assets after deducting liabilities.

At the end of each financial period, companies prepare the balance sheet, which follows the accounting equation. Essentially, the sum of all assets should be equal to the sum of total liabilities and shareholders' equity. If it doesn't, companies must balance the balance sheet.

Why should companies balance the Balance Sheet?

Balancing the balance sheet is a critical practice for companies to assure the accuracy and reliability of their financial statements. It is crucial since it ensures the following.

Verify financial accuracy

Balancing the balance sheet confirms that the equation "Assets = Liabilities + Equity" is satisfied, ensuring that all recorded financial data is accurate and consistent. It helps identify errors or discrepancies in the accounting records and allows prompt correction.

Ensure compliance

Balancing the balance sheet is a requirement for financial reporting per accounting standards such as GAAP or IFRS. It helps companies adhere to these standards, ensuring transparency and consistency in financial reporting.

Enhance stakeholder confidence

A balanced balance sheet inspires trust and confidence among stakeholders. It demonstrates the company's commitment to accurate financial reporting, fostering better relationships with investors, creditors, and regulatory authorities.

How to Balance a Balance Sheet?

If a company's balance sheet does not balance, indicating a discrepancy between assets, liabilities, and equity. Resolving balance sheet imbalances is crucial for accurate financial reporting, compliance with accounting principles, and providing stakeholders with reliable financial information. Companies can balance the balance sheet using the following steps.

Review recorded entries

Companies must thoroughly examine the recorded entries on the balance sheet to identify any potential errors, such as misclassifications, miscalculations, or missing information. They must also pay close attention to each line item to ensure accuracy.

Check supporting documentation

Companies must also verify the accuracy of the recorded data by comparing it with supporting documentation, such as bank statements, invoices, contracts, and other relevant financial records. It helps identify any discrepancies between the recorded values and the actual transactions.

Reconcile accounts

Companies must perform a detailed reconciliation of accounts, including cash, accounts receivable, accounts payable, and other significant balances. Then, they must compare those balances with external records to ensure consistency and accuracy.

Investigate transactional errors

Companies must examine individual transactions to determine if any errors occurred during data entry or if there are any duplicated or missing entries. They must also cross-reference with subsidiary ledgers and supporting documents to identify and rectify any discrepancies.

Adjust entries

Companies must make necessary adjustments to correct the imbalances on the balance sheet. It may involve reclassifying items, correcting amounts, or adding missing entries. However, they must ensure adjustments are documented and supported by appropriate evidence.

Maintain audit trail

Companies must keep a clear and comprehensive audit trail of all adjustments made to the balance sheet. Consequently, they must document the reasons for the adjustments, supporting evidence, and additional explanations to ensure transparency and accountability.

Conclusion

The balance sheet is a financial statement that reflects a company's financial position. At the end of each financial period, this statement must "balance". However, sometimes it may not. Therefore, companies must follow some steps to ensure the balance sheet balances at the end of that period. It is crucial to do so as it ensures compliance and accuracy.

Article Source Here: How to Balance a Balance Sheet


source https://harbourfronts.com/how-to-balance-a-balance-sheet/

Wednesday, May 31, 2023

Can ChatGPT Predict the Stock Market?

ChatGPT is a large-scale language model developed by OpenAI. It utilizes state-of-the-art deep learning techniques to generate human-like text responses based on the input it receives. Trained on a diverse range of internet text, ChatGPT has a vast knowledge base that allows it to understand and respond to a wide array of topics. It can engage in interactive conversations, answer questions, provide explanations, and offer suggestions.

In the financial market, ChatGPT can have practical applications in various areas. It can assist with providing real-time market updates, and financial news, thus enabling users to stay informed. Further, financial institutions can leverage ChatGPT to automate customer support, address common queries, and provide interactive assistance, enhancing customer service and engagement.

But how useful is ChatGPT in analyzing financial data, interpreting market trends, and performing complex tasks such as quantitative modeling and scenario analysis? Reference [1] examined the usefulness of ChatGPT in analyzing market sentiment.  The authors pointed out,

In this study, we have investigated the potential of ChatGPT, a large language model, in predicting stock market returns using sentiment analysis of news headlines. Our findings indicate that ChatGPT outperforms traditional sentiment analysis methods from leading vendors like RavenPack. By demonstrating the value of LLMs in financial economics, we contribute to the growing body of literature on the applications of artificial intelligence and natural language processing in this domain.

In short, the article stated that ChatGTP is a useful tool for analyzing market sentiment.

We concur with the article's perspective on ChatGPT's usefulness in analyzing market sentiment due to its language-based nature. As a language model, ChatGPT excels in understanding and interpreting textual data to gauge the overall sentiment and opinions within the market. However, after several trials, we believe that ChatGPT's current capabilities do not extend to tasks beyond language-related analysis. Complex quantitative analysis and the design of algorithmic trading systems require expertise in mathematical modeling, statistical analysis, and market dynamics, which currently fall outside the purview of ChatGPT's capabilities.

The article also highlighted the potential impact of ChatGPT and AI on the markets,

Additionally, as LLMs become more prevalent in the financial industry, it is essential to investigate their potential impact on market dynamics, including price formation, information dissemination, and market stability. Future research can explore the role of LLMs in shaping market behavior and their potential positive and negative consequences for the financial system.

Along this line, our question is: what would happen if the financial headlines and news are generated by ChatGPT and other AI machines? Will Chat GPT still be useful in analyzing its own output?

Let us know what you think in the comments below or in the discussion forum.

References

[1] Lopez-Lira, Alejandro and Tang, Yuehua, Can ChatGPT Forecast Stock Price Movements? Return Predictability and Large Language Models, https://ift.tt/VqUgcHj

Originally Published Here: Can ChatGPT Predict the Stock Market?


source https://harbourfronts.com/can-chatgpt-predict-stock-market/

How to Find Adjusted Cost of Goods Sold

The cost of goods sold (COGS) is a critical financial metric used by businesses to calculate the direct costs associated with producing or acquiring the goods or services sold during a specific accounting period. However, the COGS figure can be further adjusted to account for additional expenses or factors that impact the accuracy of the calculation. In this blog post, we will explore how to find the adjusted cost of goods sold and provide a step-by-step guide to help businesses improve the accuracy of their financial reporting.

Understanding the Basics of Cost of Goods Sold (COGS)

Before diving into the adjusted cost of goods sold, it is essential to understand the concept of COGS. COGS represents the direct costs directly attributable to the production or acquisition of the goods or services that a company sells. This typically includes costs such as the cost of raw materials, direct labor, and direct overhead expenses.

Why Adjust the Cost of Goods Sold?

The adjusted cost of goods sold takes into account additional factors that affect the accuracy of the COGS calculation. By adjusting the COGS, businesses can achieve a more precise representation of the true costs associated with producing or acquiring their goods or services. Adjustments may be necessary to account for inventory valuation methods, changes in accounting policies, allowances for obsolete or damaged inventory, and other specific circumstances unique to the business.

Steps to Find the Adjusted Cost of Goods Sold

  1. Calculate the Initial COGS: Start by calculating the initial COGS using the standard formula, which is the cost of beginning inventory plus purchases during the period minus the ending inventory.
  2. Identify the Adjustments: Review your financial records and identify any adjustments that need to be made to the initial COGS figure. These adjustments can include factors such as inventory write-offs, obsolete inventory allowances, and any changes in accounting policies.
  3. Calculate the Adjustments: For each adjustment identified, calculate the specific amount that needs to be added or subtracted from the initial COGS figure. This may require detailed analysis of inventory records, financial statements, and other relevant documentation.
  4. Apply the Adjustments: Apply the calculated adjustments to the initial COGS figure. Add or subtract the adjustment amounts to obtain the adjusted COGS.
  5. Review and Verify: Once the adjustments have been applied, review the adjusted COGS figure to ensure its accuracy. Verify the calculations and double-check any supporting documentation or references.
  6. Document and Disclose: It is essential to document the adjustments made to the COGS figure and disclose them appropriately in your financial statements. This ensures transparency and compliance with accounting standards and regulations.

Conclusion

The adjusted cost of goods sold provides businesses with a more accurate representation of the true costs associated with producing or acquiring goods or services. By following the steps outlined in this guide, businesses can calculate the adjusted COGS and enhance the accuracy of their financial reporting. It is crucial to review and verify the adjustments made, document the process, and disclose the adjusted COGS appropriately in financial statements. By doing so, businesses can improve their decision-making processes, gain deeper insights into their cost structure, and maintain compliance with accounting standards and regulations.

Post Source Here: How to Find Adjusted Cost of Goods Sold


source https://harbourfronts.com/how-to-find-adjusted-cost-of-goods-sold/