Saturday, March 6, 2021

Why Deflation Is Bad?

Most economies experience inflation regularly. Inflation represents a specific currency's purchasing power. A high increase in inflation can result in damage to most economies. Some economies may also experience negative inflation, also known as deflation. While, theoretically, it can be a good thing, it also has some drawbacks.

What is Deflation?

Deflation is an increase in the currency's purchasing power. Or it refers to the decline in the prices of goods and services. There are several reasons why deflation may occur in an economy. Usually, it relates to supply and demand. When the money or credit supply in an economy decreases, or productivity and the number of goods and services increases, it results in deflation.

How does Deflation work?

Same as inflation, the Consumer Price Index helps calculate the deflation in an economy. However, there are some factors that the index ignores, which can have an impact on it. Therefore, the index may not be a true indicator of inflation or deflation in an economy. When the index in one period for an economy is lower than the previous, inflation is said to have occurred.

Deflation usually comes with a negative signal for an economy. It results in a decrease in the money supply in a country due to lower wages, hurts investment portfolios, and even causes unemployment. Therefore, deflation may also accompany a recession in the future. As the deflation in a country increases, the chances of a recession occurring in the future also increase.

However, that does not mean deflation can only result in adverse effects. Deflation can also result in increased nominal consumer spending. Since deflation causes an increase in purchasing power of a currency, it means more people can afford items. With the increased spending by consumers, deflation can positively stimulate the economy.

Why is Deflation bad?

Despite its positive effects, deflation is usually bad for the economy. Although deflation can stimulate the economy with increased consumer spending, there is no guarantee that will happen. As the prices of goods and services start declining, consumers will postpone their spending. Usually, this is because they hope the prices will decrease even further in the future.

Therefore, deflation slows a country's economic growth. Due to the decreased spending by customers, manufacturers are forced to reduce their prices. For most consumers, it provides a choice between various products at affordable prices. However, it causes manufacturers to employ cost-cutting measures. Some manufacturers may also suffer significantly and go out of business.

Either way, deflation can cause unemployment in an economy aside from its other adverse impacts. Similarly, it decreases a country’s GDP, which can even further magnify the problem. Apart from manufacturers and consumers, deflation can also affect borrowers. They have to repay lenders a higher amount due to the increase in the currency’s purchasing power.

Overall, deflation can cause a chain of events that can lead to a severe economic decline. Long periods of continuous deflation can even force economies to go into recession.

Conclusion

Deflation refers to the increase of a currency's purchasing power. While deflation can have a good effect on an economy, in some cases, it can also impact a country adversely. Deflation can cause a decline in consumer spending as they postpone it, hoping to get lower prices in the future. It can result in lower earnings for manufacturers and can further result in other problems.

Originally Published Here: Why Deflation Is Bad?


Friday, March 5, 2021

Return on Capital Employed

There are several ratios that investors may use to gauge a company's profitability and performance. Some of these may focus on the company's profitability only. However, some others also help investors measure the company's performance and efficiency. Among those, one of the most prominent ratios is the Return on Capital Employed (ROCE).

What is Return on Capital Employed?

Return on Capital Employed is a profitability and performance ratio that allows investors to assess a company’s profitability. It does so by gauging its efficiency in managing its capital. While investors want to know how profitable a company is, it is also crucial to determine how much capital it has used. It allows investors to make better comparisons between companies of different sizes.

ROCE is one of the most favourite ratios for investors. It combines several elements related to a company's profitability into one. Simply put, it is the ratio of a company's earnings and its capital employed. Overall, ROCE provides investors with a reliable and better measure of corporate performance. It is also easy to calculate as the information needed to use the ROCE formula is available in the financial statements.

How to calculate Return on Capital Employed?

Investors can use the following ratio to calculate a company’s Return on Capital Employed.

Return on Capital Employed = Earnings Before Interest and Tax (EBIT) / Capital Employed

The Earnings Before Interest and Tax is available in a company's Income Statement. On the other hand, the capital employed is available in the company's Balance Sheet. There are two ways to calculate capital employed.

Capital Employed = Total Assets - Current Liabilities

Similarly, they can also use the following formula.

Capital Employed = Total Equity + Non-Current Liabilities

Regardless of which method investors use, investors will get the same capital employed.

Example

A company, Blue Co., had Earnings Before Interest and Tax (EBIT) of $100,000 in the last accounting period. The company also has total assets of $1 million and current liabilities of $200,000. Therefore, Blue Co.'s capital employed is $800,000 ($1 million - $200,000). It allows Blue Co. to calculate its Return on Capital Employed as follows.

Return on Capital Employed = Earnings Before Interest and Tax (EBIT) / Capital Employed

Return on Capital Employed = $100,000 / $800,000

Return on Capital Employed = 0.125 or 12.5%

How does the Return on Capital Employed work?

Return on Capital Employed is a metric that allows investors to compare various companies. Usually, a higher ROCE means that the company has efficiently used its resources to generate profits. ROCE is also useful in comparing companies in capital-intensive industries, allowing investors to make better decisions.

Return on Capital Employed shows how much earnings a company makes for each dollar of capital employed. It considers the EBIT, which shows how much profits a company generates from its operations only. Similarly, by incorporating equity and long-term debt, ROCE allows investors to consider the long-term capital which a company employs.

Conclusion

Return on Capital Employed is one of the most preferred ratios for investors. It allows them to gauge a company's profitability and efficiency in using its resources. In short, Return on Capital Employed is the ratio of a company's EBIT and its capital employed. The higher a company's ROCE is, the better it is for investors.

Article Source Here: Return on Capital Employed


Thursday, March 4, 2021

Return on Invested Capital

Investors can use various profitability ratios to evaluate whether they should invest in a company. Some of these ratios are basic and allow investors to determine whether the company is profitable. However, investors may also want to know the returns they will get on their invested amounts. For these calculations, investors may use the Return on Invested Capital (ROIC).

What is Return on Invested Capital?

Return on Invested Capital is a profitability ratio that represents the percentage return that companies earn from their invested capital. ROIC is a metric that allows investors to determine how efficiently a company allocates its resources to make profits. Investors can use ROIC to gauge how much they can earn for the amount of investment they make in the company.

How to calculate Return on Invested Capital?

Investors can use the following formula to calculate the Return on Invested Capital for a particular investment.

Return on Invested Capital (ROIC) = Net Operating Profit After Tax (NOPAT) / Invested Capital

For the above formula, investors must first determine how much return the company generates. It includes after-tax earnings but before interest payments. This amount is not available in the company's financial statements. Therefore, investors will have to calculate it manually. The formula for NOPAT is as below.

NOPAT = Earnings Before Interest and Taxes (EBIT) x (1 - Tax Rate)

Most of the information for the above formula is available in a company's Income Statement. Therefore, calculating NOPAT should be straightforward.

Next, they must determine the value of the invested capital. Invested capital represents the amount that investors have contributed to the company through the purchase of shares. There are various ways to calculate the invested capital for a company. Firstly, there is the following formula.

Invested Capital = Total Debt + Total Equity and Equivalent Equity Investments + Non-Operating Cash

However, investors may also use the following formula to calculate the invested capital.

Invested Capital = Net Working Capital + Net Fixed Assets + Net Intangible Assets

Example

A company, Green Co, has Earnings Before Interest and Tax of $100,000. Similarly, the tax rate prevalent for the company is 20%. The total invested capital of Green Co. is $400,000. Therefore, Green Co.'s Return on Invested Capital will be as follows.

Return on Invested Capital = Net Operating Profit After Tax (NOPAT) / Invested Capital

Return on Invested Capital = [$100,000 x (1 - 20%)] / $400,000

Return on Invested Capital = 0.2 or 20%

How does Return on Invested Capital work?

The Return on Invested Capital formula returns a percentage value. It provides a measure of a company’s performance, showing much return it generates for each dollar of invested capital. Unlike some other ratios, investors can use ROIC both on its own and comparatively. They may also use as a comparative tool with a company’s weighted average cost of capital.

Usually, the higher a company's ROIC is, the more profitable and efficient it is. Similarly, companies with ROIC higher than their WACC maximize returns for the invested capital. Investors also prefer to invest in companies that have an ROIC of at least 2% or higher. Anything below that usually indicates an inefficient use of resources.

Conclusion

Return on Invested Capital is a measure of efficiency and profitability for companies. Investors use it to determine whether they should invest in a company or not. The ROIC formula requires investors to take the ratio between a company's returns and its invested capital. Investors can use ROIC on its own or comparatively. They can also use it to compare a company's ROIC with its WACC.

Post Source Here: Return on Invested Capital


Wednesday, March 3, 2021

What Is Inflation Risk?

Inflation refers to the decrease in a currency's purchasing power. It can come as a result of various factors. Inflation isn't necessarily a bad thing, as it can also accompany positive changes. However, it usually has adverse effects on businesses and individuals. Inflation risk, also known as purchasing power risk, exists for all companies that suffer from inflation.

What is Inflation Risk?

Inflation risk refers to the uncertainties or hazards involving inflation. For companies, it refers to the risk that inflation may occur and accompany adverse impacts. Inflation risk represents how changes in prices of goods and services can affect a company's operations negatively. Similarly, it may refer to the decrease in purchasing power more than expected by a company.

Inflation risk also exists for investors. In that context, it refers to the risk that inflation will undermine an investment's performance. Usually, investors want to get returns above the inflation rate that occurs. Therefore, they take inflation into account when making decisions about their portfolios. If the cash flows from an investment are lower than the inflation rate, then investors have to suffer.

How does Inflation Risk work?

When investors invest in security, they will expect a specific amount of return. For example, when investing in bonds, investors can expect a fixed-income. These investments may be short- or long-term. While inflation risk may exist for short-term investments, it does not have a significant impact. For long-term investments, inflation risk may have a substantial effect.

Investors that invest in long-term securities want the returns from them to exceed the inflation rate. For fixed-rate returns, inflation rates will have a significant impact on the returns. However, the same is not the case for securities that account for inflation, for example, inflation-rate or floating-rate bonds. In these cases, the inflation risk will be minimal or at least lower than for fixed-rate securities.

Why is Inflation Risk crucial?

Inflation risk is crucial for investors as it dictates the returns they receive and expect. As mentioned, inflation risk has more impact on long-term investments compared to short-term ones. Similarly, it will affect fixed-rate investors more. Since more inflation means these investors will get lower returns, inflation risk is crucial for them.

If investors fail to consider the impact of inflation on their investments, they can suffer considerably. Due to the decrease in purchasing power, investors receive returns that have a lower value. That is despite receiving the same amount over the period. Inflation risk will always exist in any economy. Therefore, investors need to consider it when making investment decisions.

Similarly, inflation risk doesn't only encompass the risk of inflation occurring. It is the risk that the inflation rate is higher than what investors anticipated. Since investors need to adjust for inflation beforehand, any difference between their estimate and actual inflation can also be critical. Overall, inflation risk plays a significant role in investments and the returns that investors get.

Conclusion

Inflation risk is the risk that inflation may bring about adverse change with it. Similarly, it represents the risk that inflation occurs at a higher rate than anticipated. Inflation risk is crucial for both businesses and investors. Since inflation causes a decrease in a currency's purchasing power, inflation risk can affect long-term profitability.

Article Source Here: What Is Inflation Risk?


Tuesday, March 2, 2021

Fama French 3 Factor Model

The Capital Asset Pricing Model (CAPM) is a model that describes the relationship between systematic risk and anticipated returns. It is a model commonly used by companies to calculate their cost of capital. They may also use some other models. However, CAPM considers the systematic risk of investments, making it a prime choice for risky investments. There are some variations of the CAPM as well, such as the Fama-French Three-Factor Model.

What is the Fama French 3 Factor Model?

The Fama-French 3 Factor Model aims to extend the usefulness of the CAPM. This model considers two other factors apart from the systematic risk related to an investment. Most small-cap stocks outperform markets regularly. Similarly, high book-to-market value companies tend to outperform those with a low book-to-market value.

The Fama-French model considers both possibilities. It does so by considering three factors. Firstly, it includes the market risk that CAPM already encompasses. In addition to that, it also reflects size risk and value risk. Therefore, this model extends on the CAPM functionality by considering crucial factors prevalent in the market.

Since the Fama-French 3 factor model includes more risks, it also tweaks the formula used for CAPM.

What is the formula for the Fama French 3 Factor Model?

The Fama-French 3 factor model expands the original CAPM formula, which is as below.

Expected Rate of Return = Risk-free Rate of Return + Market Risk Premium

However, the above formula only considers the market risk. As mentioned, the Fama-French 3 factor model also includes two other risks, which are size risk and value risk. Therefore, the Fama-French 3 factor model formula is as below.

Expected Rate of Return = Risk-free Rate of Return + Market Risk Premium + SMB + HML

Mathematically, the formula for the model is as below.

r = rf + β1(rm - rf) + β2(SMB) + β3(HML)

Given below is what each of the symbols in the above formula represents.

r = Expected rate of return

rf = Risk-free rate of return

β = Factor’s coefficient

(rm - rf) = Market risk premium

SMB (Small Minus Big) = Size premium

HML (High Minus Low) = Value premium

What is the Importance of the Fama French 3 Factor Model?

The Fama-French 3 factor model explains more than 90% of the diversified portfolio's returns. In comparison, the CAPM only explains 70% of it. It considers any outperformance tendencies of the two types of stocks mentioned above. By including the two extra risk factors, the Fama-French 3 factor model provides more flexibility to investors.

The model also explains that over a long time, investors get rewards for any losses they suffer in the short-term. Therefore, they can absorb any short-term volatility and periodic underperformances over a short period of time. Recently, there has been another variant of the Fama-French 3 factor model which considers even more factors.

The Fama-French Five-Factor Model is a recent development based on the three-factor model that considers some additional factors. These include low volatility, momentum, and quality. Overall, the Fama-French model is crucial for investors looking to move beyond the traditional CAPM.

Conclusion

The Capital Asset Pricing Model is a financial model that explains the relationship between systematic risk and anticipated returns. The Fama-French 3 Factor Model extends on CAPM’s functionality by considering two additional factors. These include size risk and value risk. This model is crucial for various reasons mentioned above.

Post Source Here: Fama French 3 Factor Model


Monday, March 1, 2021

What Does Due Diligence Mean?

What does Due Diligence mean?

Due diligence is the process of investigating, reviewing, and auditing that companies and businesses perform. Usually, they do so to confirm facts relevant to a financial transaction. For example, companies may perform due diligence before acquiring another company. They may do so to verify whether the acquisition will be profitable.

Companies also use due diligence to confirm that they don't miss other matters during decision-making. Due diligence is crucial before conducting various financial transactions, for example, mergers and acquisitions. Either way, it involves the assessment of financial records before completing a transaction with another participant.

What are the various types of Due Diligence?

There are many types of due diligence that companies may utilize during different processes. Some of the most prominent types include the following.

Financial Due Diligence

Financial due diligence is the process that companies perform to confirm that financial information. It is common for companies to conduct financial due diligence when acquiring other companies. The requirements of the process will differ according to the company's needs. They do so to obtain certainty about the other company.

Asset Due Diligence

Another type of due diligence that is common among companies is asset due diligence. With this type, companies confirm several things about assets reported in a company’s financial statements. These may include an asset’s existence, legal rights, sale and purchase documents, lease documents, mortgages, etc.

Taxes Due Diligence

Companies may also perform tax due diligence to confirm the tax liability of a target company is accurate. During this process, they might assess whether the company has reported its tax liability properly. Similarly, they may seek some documentation related to it, such as tax returns, tax audit details, etc.

Administrative Due Diligence

Administrative due diligence is also common to confirm admin-related aspects of a company. These may include verifying the facilities that a company owns or occupies. Similarly, companies may use administrative due diligence to get insights into a target company's operating costs. During this process, they may also verify whether they have reported their expenses accurately.

Human Resources Due Diligence

Human resources represent human capital that companies cannot report in their financial statements. Despite that, they are a crucial part of a company's success. Human resources due diligence allows companies to assess information about a target company's workforce. It may include analyzing its total employees, salary expense, employment contracts, benefits, etc.

What is the importance of Due Diligence?

Due diligence can be crucial for several reasons. A proper due diligence process can provide a higher chance of successful investments. Similarly, buyers can use it to verify several critical factors during mergers and acquisitions. It also allows them to develop expectations from the transaction. For the seller, due diligence can also be beneficial to leverage their position in the acquisition.

Companies can use due diligence in several ways. For example, they may use it to confirm and verify the information before completing a transaction. They can also identify any problems promptly that may affect their decision. Companies also set some criteria for the process, which allows them to customize the process, according to their requirements.

Conclusion

Due diligence is an extensive process that companies use to verify financial information about a target company. It is common for companies to use it during mergers and acquisitions. There are several types of due diligence that companies may perform. This process is beneficial for both the buyer and the seller.

Article Source Here: What Does Due Diligence Mean?


Sunday, February 28, 2021

Pricing of Weather Derivatives Using Monte Carlo Simulations

Derivatives are financial products whose values are determined by the current price of the underlying asset or portfolio. Weather derivatives are a particular class of financial instruments that individuals or companies can use in support of risk management in relation to unpredictable or adverse weather conditions. While some may see them as an exciting innovation, there is considerable debate about the future of weather derivatives and their suitability to specific situations. The main argument against them is that they are too complex and difficult to understand for the average person. Notably, the valuation of weather derivatives is not trivial as it often requires the modeling of an index whose forecast value can change drastically over the next few hours or days. We note that,

There is no standard model for valuing weather derivatives similar to the Black–Scholes formula for pricing European style equity option and similar derivatives. That is because the underlying asset of the weather derivative is non-tradeable which violates a number of key assumptions of the BS Model. Typically weather derivatives are priced in a number of ways…

[Index modelling] approach requires building a model of the underlying index, i.e. the one upon which the derivative value is determined (for example monthly/seasonal cumulative heating degree days). The simplest way to model the index is just to model the distribution of historical index outcomes. We can adopt parametric or non-parametric distributions. For monthly cooling and heating degree days, assuming a normal distribution is usually warranted. The predictive power of such a model is rather limited. A better result can be obtained by modelling the index generating process on a finer scale. In the case of temperature contracts, a model of the daily average (or min and max) temperature time series can be built. The daily temperature (or rain, snow, wind, etc.) model can be built using common statistical time series models (i.e. ARMA or Fourier transform in the frequency domain) purely based only on the features displayed in the historical time series of the index. A more sophisticated approach is to incorporate some physical intuition/relationships into our statistical models based on spatial and temporal correlation between weather occurring in various parts of the ocean-atmosphere system around the world (for example, we can incorporate the effects of El Niño on temperatures and rainfall). Read more

Despite these difficulties, efforts are being made to price weather derivatives accurately. A recent paper [1] presents a valuation method for pricing an exotic wind power option using Monte Carlo simulations.

Wind power generators face risks derived from fluctuations in market prices and variability in power production, generated by their high dependence on wind speed. These risks could be hedged using weather financial instruments. In this research, we design and price an up-and-in European wind put barrier option using Monte Carlo simulation. Under the existence of a structured weather market, wind producers may purchase an up-and-in European wind barrier put option to hedge wind fluctuations, allowing them to recover their investments and maximise their profits. We use a wind speed index as the underlying index of the barrier option, which captures risk from wind power generation and the Autoregressive Fractionally Integrated Moving Average (ARFIMA) to model the wind speed. This methodology is applied in the Colombian context, an electricity market affected by the El Niño phenomenon. We find that when the El Niño phenomenon occurs, there are incentives for wind generators to sell their energy to the system because their costs, including the put option price, are lower than the power prices. This research aims at encouraging policymakers and governments to promote renewable energy sources and a financial market to trade options to reduce uncertainty in the electrical system due to climate phenomena.

References

[1] Y.E. Rodríguez, M.A. Pérez-Uribe, J. Contreras, Wind Put Barrier Options Pricing Based on the Nordix Index, Energies 2021, 14, 1177.

Originally Published Here: Pricing of Weather Derivatives Using Monte Carlo Simulations


Saturday, February 27, 2021

How to Determine Implied Dividend Yield-Derivative Valuation in Excel

Dividend yield is an input into the option valuation model that often receives little attention from the practitioners. This is probably because the majority of companies do not pay dividends. And for those that pay, an inaccuracy in the estimation of the dividend yield often has a small impact on the fair value of the financial instrument, especially if the tenor of the instrument is short.

However, under some circumstances, dividend can become an important input in the valuation model, and an inaccurate estimation can lead to a severe financial loss. This is what happened with a French bank during the pandemic,

The bank also lost about 100 million euros on dividend futures for the quarter, the people said. The losses had surged at one point to about 300 million euros before improving, according to the people. Dividend futures are derivatives that investors use to speculate on the payouts that companies make to shareholders. They have tumbled to historic lows in recent weeks as some of the world’s biggest corporations shred their awards in response to the coronavirus and, in some industries, pressure from regulators. Read more

In this post, we discuss ways to determine the dividend yield accurately. In the option pricing model, the most accurate dividend yield is the implied one that can be calculated from

  1. Dividend futures,
  2. Traded single stock futures, or
  3. Traded options.

We’re not going to discuss dividend futures here as they are over-the-counter instruments and not traded frequently. Single stock futures, on the other hand, have been traded more frequently than dividend futures, but they are illiquid and the number of available single stock futures is still small.

This leaves us with the last choice, i.e. using traded options to determine the implied dividend yield. Specifically, if the options are of European-style exercise, then we can use the put-call parity to create a synthetic single stock future, i.e.

Implied dividend in Excel

where C(K,t) is the call price at time t,

            P(K,t) denotes the put price,

            K is the strike price,

           S is the stock price,

           r is the risk-free rate,

          T is the time to maturity, and

          q is the continuous dividend yield.

Note that equation (1) is model-free, and the implied dividend yield can be extracted easily by using it.  This method has been implemented in an Excel spreadsheet.

implied dividend yield

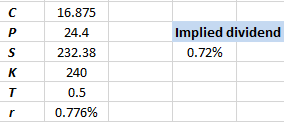
As an example, we are going to calculate the implied dividend for Microsoft (MSFT) as of Feb-26-2021. The picture bellows shows the price of the 6-month call option with a strike price of $240. The price of the put option, as well as the risk-free rate, are provided in the Excel spreadsheet.

The picture below shows the calculated implied dividend yield from MSFT traded option prices. We obtain an implied dividend yield of 0.72%.

implied dividend in Excel

Note that in the above example, for illustration purposes we assumed that the options are European style, but in fact they are American style, as is the case for most equity options. This means that the put-call parity no longer holds, and we cannot use eq (1) to calculate the implied dividend yield.

Fortunately, there is a viable solution. Reference [1] presents a method that generalizes the put-call parity for the case of American options. Essentially, the author introduces a so-called early exercise premium into equation (1), thus allowing the generalized put-call parity relationship continues to be used in the calculation of the implied dividend yield.

A novel element in this methodology is that it clears the hurdle of dealing with the early exercise premium that is not present in index options but is an element of value in American style options of US stocks. The Cox, Ross and Rubinstein (1979) binomial tree takes account of this premium and the tree is constructed simultaneously for a pair of put and call options with otherwise equal characteristics by guessing the same values for implied dividends and implied volatilities for the put and call pricing models. Analyzing dividends from stock options thus implied reveals their predictive power and adds to the understanding of cross-sectional stock returns.


Click on the link below to download the Excel spreadsheet.

References

[1] J, Kragt, Option Implied Dividends, https://ssrn.com/abstract=2980275

Article Source Here: How to Determine Implied Dividend Yield-Derivative Valuation in Excel


Friday, February 26, 2021

Buy-Side vs Sell-Side Analysts

Financial analysts study various companies to identify ones from which investors can benefit. Among these, there are two types of analysts. These include buy-side and sell-side analysis. Both of these are different in various aspects.

Who are Buy-Side Analysts?

Buy-side analysts are institutional investors who collect money from investors and invest it across various asset classes. They use different investing strategies to do so. A buy-side analyst seeks to determine whether an investment will be profitable and will fit the investment strategy. Once they do so, they can make recommendations to the investors for their funds.

Buy-side analysts work to provide benefits to the funds that pay them. Therefore, they limit their recommendations to only the fund. For buy-side analysts, identifying the right investments is crucial for long-term success. It is because investors measure their performance based on whether the recommendations they make are profitable.

Buy-side entities include hedge funds, asset management, institutional investors, private equity, ETFs, etc. The job of these institutions is to identify profitable investments for investors. For that, they identify relevant investments and gather information about them. Similarly, they use several models and techniques to gauge performance.

Buy-side analysts also interact with sell-side analysts. They use reports generated by sell-side analysts to carry out further analysis of their own. While sell-side analysts will make their information available to the public, buy-side analysts don't. Similarly, buy-side analysts provide a more detailed analysis of the financial information for a specific purpose.

Buy-side analysts involve analysts that require higher knowledge and skills than sell-side analysts. It is because they perform more technical analysis and provide better services to clients. However, that also means that they may come with higher costs to investors compared to other options.

Who are Sell-Side Analysts?

Sell-side analysts primarily provide unbiased recommendations based on the research they conduct on securities. They usually do so by following a list of companies within the same industry. It is different from buy-side analysts who follow stocks across various industries. Then they provide regular research reports to their clients.

Similar to buy-side analysts, sell-side analysts also create models to forecast a company's financial results. Unlike buy-side analysts, however, they don't conduct the research at a high level. For sell-side analysts, the research reports and forecasts are the primary output. They also provide price targets and recommendations on how they estimate a stock will perform.

The reports that sell-side analysts provide are available to the public. Therefore, anyone can use them according to their needs, which also includes buy-side analysts. However, they must create value for the services they provide for them to be successful. Usually, they do so by providing clients with comprehensive and detailed reports. Similarly, it may involve answering clients face-to-face.

Sell-side analysts primarily include investment banking. However, it may also consist of commercial banks, stockbrokers, and market makers. These entities provide all the services mentioned above while also facilitating buying and selling of securities between investors. Essentially, the job of sell-side investors is to convince clients or act like marketers.

Conclusion

There are various types of financial analysts in the market that may provide recommendations to investors. Buy-side analysts include entities that provide detailed analysis and recommendations to clients. They must make the right recommendations to stay successful. Sell-side analysts also make recommendations. However, these are not as detailed and are publicly available.

Post Source Here: Buy-Side vs Sell-Side Analysts


How Leveraged Buyout Works

What is a Leveraged Buyout?

A leveraged buyout represents a strategy that companies use to acquire other companies using debt as the primary source of finance. Leveraged buyouts may also include using the acquired company's assets as collateral to finance the transaction. Sometimes, however, companies may also use their own assets to obtain the debt for leveraged buyouts.

Leveraged buyouts can be a hit or a miss for companies. Usually, it involves undertaking a significant amount of risk to finance these buyouts. Similarly, the acquiring company relies on the acquired company’s performance to repay the loan. Therefore, any problems within this plan can cause issues for the acquiring company.

How do Leveraged Buyouts work?

Leverage buyouts start when a company wants to buy out another company. As with any other transactions, they will need to finance the acquisitions. With leveraged buyouts, these funds come through debt rather than the acquiring company's equity. Therefore, companies may use a significant amount of debt to finance the transaction.

Usually, leveraged buyouts involve a 90% ratio of debt while the rest comes from the acquiring company's equity. The acquiring company may issue bonds to acquire this debt. Due to the risk involved, however, the bond will be high-return rather than investment-grade. Leveraged buyouts usually include using aggressive tactics to acquire another company.

Leveraged buyouts can occur through a company's current management or employees. Similarly, private equity firms may also participate in it. There may be several reasons for leveraged buyouts. These may include transferring private property, taking a public company private, or spinning-off a portion of an existing company and sell it. Similarly, companies may use leveraged buyouts to acquire a competitor and improve underperforming companies.

Which companies are more prone to Leveraged Buyouts?

Some companies are more prone to leveraged buyouts compared to others. These include companies that are in a mature industry. Similarly, companies that have stable and predictable earnings are better candidates for this purpose. It is because the acquiring company takes high risks on the acquisition. Therefore, having stability can help in repaying debts later.

Similarly, companies with a strong team of personnel and involved in cost-cutting measures are prime candidates for leveraged buyouts. Acquiring companies also prefer target companies that have a clean balance sheet with minimal debt. Some other factors may also play a role in deciding whether companies will choose a target company for leveraged buyouts.

What are the advantages of Leveraged Buyouts?

Leveraged buyouts are advantageous to the acquiring companies. Through leverage, companies can finance acquisitions without having the equity necessary to do so. It also provides them with an opportunity to earn a higher return on investment. For some companies, acquiring underperforming companies and turning around can also yield significant returns.

Leveraged buyouts can also be advantageous for sellers. The primary advantage is that sellers can dispose of their companies during their peak performance periods. This way, they can earn the maximum amount of money. Similarly, companies that are on the verge of failure or in a bad market position can also benefit from leveraged buyouts.

Conclusion

A leveraged buyout is the process of financing acquisitions primarily through debt. For the acquiring companies, it presents a significant amount of risk that they undertake to acquire finance. Leveraged buyouts can happen for several reasons. These can have various advantages for both the buyer and the seller, as mentioned above.

Post Source Here: How Leveraged Buyout Works