Saturday, December 5, 2020

Yield to Maturity Formula

What is Yield to Maturity?

Yield to Maturity (YTM) shows the internal rate of return of a bond in comparison to its current market price. Other names used for YTM are book yield or redemption yield. YTM represents the anticipated return on a bond based on the assumption that the bondholder holds it until the date of its maturity. Yield to Maturity also assumes that the investor buys a  bond at the current market price and all interest payments occur on a timely basis.

How to Calculate Yield to Maturity?

The formula to calculate the Yield to Maturity of a bond is as below.

Formula for Yield to Maturity

In the above formula, 'C' represents the interest or coupon payment of the bond. 'FV' and 'PV' denote the face and the present value of the bond. The face value of a bond represents its value when first issued. Usually, the issuer of the bond sets its value at the time of its issuance. Finally, 't' denotes the time it would take for the bond to reach its maturity.

Yield to Maturity vs Current Yield

The Yield to Maturity of a bond is closely related to its Current Yield. The current yield of a bond represents its total cash inflows divided by its market price. Usually, the cash inflows from a bond only consist of the interests received from it, calculated using the face value of the bond multiplied by its applicable interest rate.

Example

A company, Rise Co., issued bonds with a 5% yearly coupon rate. The par value of its bonds is $100. Furthermore, the current market value of the bond is $95. Its maturity period is 10 years. Therefore, using the above formula, the yield to maturity of Rise Co.'s bonds will be as follows.

Yield to Maturity = [($5 + (($100 - $95) / 10)) / (($100 + 95) / 2)]

Yield to Maturity = 5.64%

For the same bond, the current yield will be as follows.

Current Yield = $5 / $95

Current Yield = 5.26%

Importance of Yield to Maturity

Yield to Maturity is a critical metric for investors when deciding whether they want to invest in a bond or dispose of their owned bonds. Investors can calculate the YTM of a bond and compare it with other bonds to decide which of them has the best returns. Similarly, they can use YTM to compare the yields from a bond with their required yield for decision-making. YTM also makes great comparison tools for bonds with different maturities.

Limitations of Yield to Maturity

Despite its uses, Yield to Maturity can also have some limitations. Firstly, YTM does not consider the taxes paid or transaction costs that investors pay for the bond. Similarly, YTM makes some assumptions about the future, which may not be correct. For example, it assumes that investors will reinvest all the returns received from a bond and that they will hold the bond until maturity and get repaid for it.

Conclusion

Yield to Maturity is a crucial metric for investors. It shows the internal rate of return of a bond in comparison to its current market price. Similarly, YTM is closely related to the Current Yield of a stock. YTM is critical for investors in their decision-making process. However, it has certain limitations, as well.

Post Source Here: Yield to Maturity Formula


Friday, December 4, 2020

Interest Rate Compounding Formula

What is compounding?

Compounding refers to the process of increasing the value of an asset or investment based on the interest earned on its principal amount and its accrued interest. Usually, compounding consists of calculating the interest on the carrying value of the investment for each period. The carrying value of the investment is the sum of its principal amount and its accrued interest till that point.

Compounding is a concept used with Time Value of Money to calculate the future value of investments based on their present values. Similarly, compounding is common in calculating the compound interest of loans or investments based on their principal amounts.

What is compound interest?

Compound interest refers to interest calculated based on the principal amount and any subsequent interests from loans. In other words, compound interest is the interest calculated by multiplying the applicable interest rate with the initial principal value and accumulated interest from any prior periods. Less commonly, compound interest is also known as "interest on interest".

Compound interest is an alternative way to calculate interest as opposed to simple interest. Simple interest, in contrast, is the interest calculated by multiplying the initial principal amount of a loan or investment with the applicable interest rate. It does not consider any subsequent interest earned from the loan. Therefore, with simple interest, the number of interest payments does not matter while with compound interest, they do.

Compounding formula

Compounding is the process of calculating the future value of the compound interest of a loan or investment. The formula used to calculate compound interest is as follows.

FV = PV x (1 + i)n

In the above formula, ‘FV’ represents the future value of the loan or investment after the compounding effect. ‘PV’ denotes the present value of the loan or its principal value. ‘i’ represents the interest rate of the loan. Finally, ‘n’ is the number of compounding periods. Usually, both the ‘i' and 'n', or the interest rate and the number of periods are annual.

Example

A bank provides loans to its customers for which they have to pay an annual interest rate of 5%. Customers can obtain a loan of $100,000, which they have to repay in 6 years. Based on the above formula, the future value of the repayment that its customers must return will be as follows.

FV = PV x (1 + i)n

FV = $100,000 x (1 + 5%)6

FV = $134,010

Customers can also calculate the compounding effect by manually adding the accrued interest at the end of each period to the carrying value of the loan and multiply it with the applicable interest rate. Therefore, the calculation will look as follows.

Period

Carrying value before interest
(A)

Interest on CV
(B)

Carrying value after interest
(A + B)

1

 $       100,000

 $  5,000

 $   105,000

2

 $       105,000

 $  5,250

 $   110,250

3

 $       110,250

 $  5,513

 $   115,763

4

 $       115,763

 $  5,788

 $   121,551

5

 $       121,551

 $  6,078

 $   127,629

6

 $       127,629

 $  6,381

 $   134,010

Conclusion

Compounding is a concept used in the calculation of the future value of the compound interest of a loan or an investment. Compounding works by multiplying the applicable interest rate with the sum of the principal amount and accrued interest of an investment based on the total number of periods for which it stands.

Originally Published Here: Interest Rate Compounding Formula


Thursday, December 3, 2020

What is Cost Of Capital

Cost of capital represents the minimum rate of return that a company or business must earn from its investments to make a profit on it. Usually, the cost of capital of a company consists of its cost of debt and cost of equity. Therefore, the company's capital structure plays a vital role in the determination of its cost of capital.

The cost of capital is a crucial concept used in capital budgeting and investment appraisal process of a company. It is a requirement when using investment appraisal tools based on the time value of money. Unless a company only has equity or debt capital, it must calculate its cost of capital. Both investors and companies can use the cost of capital for different decision-making purposes.

How to calculate the Cost of Capital?

The calculation of the cost of capital usually comes in the form of the Weighted Average Cost of Capital (WACC). It considers the cost of both the equity and debt finance of a company weighted proportionately according to their value. The resulting figure presents the average cost of capital that the company must meet in its investments.

The formula for WACC is as below.

WACC = Ke x [Ve / (Ve + Vd)] + Kd x [Vd / (Ve + Vd)] x (1 - T)

In the above formula, ‘Ke’ and ‘Kd' represent the cost of equity and debt of the company, respectively. On the other hand, ‘Ve’ and ‘Vd’ represent the value of equity and debt of the company. Finally, ‘T’ represents the corporation tax percentage of the company.

Example

A company, Sam Co., has total equity of $100,000 and a debt of $25,000. Its cost of equity and debt is 10% and 8% respectively. The corporation tax percentage for Sam Co. is 10%. To calculate its cost of capital, Sam Co. must use the Weighted Average Cost of Capital formula given above.

WACC = Ke x [Ve / (Ve + Vd)] + Kd x [Vd / (Ve + Vd)] x (1 - T)

WACC = 10% x [$100,000 / ($100,000 + $25,000)] + 8% x [$25,000 / ($100,000 + $25,000)] x (1 - 10%)

WACC = 8% + 1.8%

WACC = 9.8%

Sam Co.'s cost of capital is close to its cost of equity. It is because a majority of the company's capital structure consists of equity. Similarly, the company’s cost of debt is also close to its cost of equity. However, the post-tax cost of debt is only 7.2% (8% x [1 - 10%]), which further increases its cost of capital.

For more example, see

Weighted Average Cost of Capital (WACC)-Business Valuation Calculator in Excel

Why is the cost of capital important?

Cost of capital is widely used for financial and accounting purposes. First of all, the cost of capital helps businesses and investors to make decisions regarding their investments. Similarly, the cost of capital plays a critical role in resource allocation within the company. Furthermore, it helps businesses determine and establish an optimal capital structure to reduce costs. Similarly, it can also serve as a performance appraisal tool for projects.

Conclusion

Cost of capital is the minimum rate of return that a company must require from its investments to make profits. It often comes in the form of the Weighted Average Cost of Capital. WACC bases the calculation of the cost of capital by proportionately weighing a company's cost of equity and debt.


Originally Published Here: What is Cost Of Capital


Wednesday, December 2, 2020

Internal Rate of Return

Internal Rate of Return (IRR) is a discount rate at which the Net Present Value (NPV) of a project is zero. In other words, IRR is the discount rate at which the present value of all cash flow from a project equals its initial capital investment. IRR is one of the most commonly used and popular metrics when it comes to investment appraisal and capital budgeting. The IRR method, through its use of NPV, follows the time value of money concept.

How to calculate the Internal Rate of Return?

Before calculating the internal rate of return of a project, it is crucial to calculate its net present value at two different rates of return. The calculation of IRR also produces more accurate results if one of the NPVs calculated is positive, and the other is negative. Similarly, the closer both NPVs are to each other, the more accurate IRR it will produce.

Below is the formula to calculate the IRR of a project.

IRR = L + [NL / NL - NH x (H - L)]

In the above formula, 'L' represents the lower rate of return used in the calculation of NPV of the project. Usually, the lower rate of return will return a higher or preferably a positive NPV. Therefore, 'NL’ denotes the NPV of the project calculated based on the lower rate of return. Similarly, ‘H’ represents the higher rate of return, while ‘NH' denotes the NPV of the project calculated using the higher rate. It is preferable that the value of 'NH’ is negative to produce a more accurate result.

How to make decisions based on the Internal Rate of Return?

The decision made based on the IRR of a project is straightforward. Usually, all businesses determine their required rate of return, which is the minimum return they want from a project. As stated above, IRR represents a point at which the NPV of a project is nil. For decision-making, any project that has an IRR higher than the required rate of return of the business is considered viable.

On the other hand, if the IRR of a project is lower than the required rate of return, then it is considered loss-making and often rejected. Sometimes, even projects with positive NPVs might get declined if their IRR is lower than the required rate of return of the business.

Example

A company, Jet Co., wants to take up a new project. The company has already calculated the NPV of the project at two different rates of return. At a 10% rate of return, the NPV of the project is $5,000. At 15%, the NPV is -$3,000. Jet Co.’s required rate of return for the project is 12%. The company must, therefore, calculate the IRR of the project to make a decision.

The calculation of IRR for the project is as follows.

IRR = L + [NL / NL - NH x (H - L)]

IRR = 10% + [$5,000 / ($5,000 - (-$3,000)) x (15% - 10%)]

IRR = 10% + [$5,000 / $8,000 x 5%]

IRR = 13.13%

Based on this calculation, Jet Co. can approve the project as the IRR of the project (13.13%) exceeds its required rate of return (12%).

Conclusion

Internal Rate of Return represents the discount rate at which the net inflows and outflows of a project equal to zero. Businesses must calculate the NPV of the project, that they are evaluating, at two different rates of return to calculate its IRR. If the IRR of the project exceeds the required rate of return, then it is considered viable.

Post Source Here: Internal Rate of Return


Tuesday, December 1, 2020

How to Calculate Net Present Value

Companies and businesses use different tools in their capital budgeting and investment appraisal process. Some of these tools are simpler, while others require complex calculations based on the time value of money concept. One such tool that is most commonly used by businesses is Net Present Value (NPV).

What is Net Present Value?

Net Present Value (NPV) is a method used in investment appraisal to calculate the present value of all the future cash flows of a project, including its initial capital investment. In other words, NPV calculates the present value of the cash flows of a project by deducting all its cash inflows from its outflows. The name also suggests that it is the net of all the present values of cash inflows and outflows of a project.

How to calculate Net Present Value?

Calculating the NPV of a project often requires complex calculations and takes into account several factors. However, the following formula can help in the determination of NPV in its simplest form.

NPV = Cash flows / (1 + r)n - Initial capital investment

First of all, the above formula only assumes fixed annual cash flows. If the cash flows from a project are not constant, it doesn't work. 'r' in the above formula represents the required rate of return or discount rate. 'n', on the other hand, signifies the number of periods for which the project will run.

How to make decisions based on Net Present Value?

One of the reasons why NPV is a commonly used model is because of its straightforward decision-making rules. When making decisions based on NPV, businesses have to determine whether the NPV of a project is positive or negative. A positive NPV means that the project will generate more inflows as compared to its outflows and, therefore, is viable for the business.

On the other hand, a negative NPV means the outflows caused by a project exceed its inflows. Thus, the project will end up generating a loss for the business that is taking up the project. Therefore, any project with a negative NPV is not viable.

Example

A company, Green Co., wants to start a new project. Initially, the company will have to invest $100,000 in capital into the project. Eventually, the project will start generating cash inflows of $30,000 for the next 6 years. Green Co.'s required rate of return is 10%. Therefore, the project's net present value will be as follows.

NPV = Cash flows / (1 + r)n - Initial capital investment

NPV = ($30,000 x 6) / (1 + 10%)6 - $100,000

NPV = $101,580 - $100,000

NPV = $1,580

In this case, the NPV of the project for Green Co. is positive as the cash inflows ($101,580) exceed the initial capital investment required for the project ($100,000). Therefore, Green Co. must take the project as it will result in a profit in the future.

Conclusion

Net Present Value is a commonly used investment appraisal tool. The NPV of a project represents the net value of the present value of its cash inflows and outflows. If the NPV of a project is positive, it means the project will make a profit and, therefore, is viable. On the other hand, a negative NPV represents a loss-making project.

Originally Published Here: How to Calculate Net Present Value


Monday, November 30, 2020

Modern Portfolio Theory-Portfolio Management in Python

Harry M. Markowitz is the founder of Modern Portfolio Theory (MPT) which originated from his 1952 essay on portfolio selection. He was later awarded a Nobel Prize in Economics. His work founded the concept of an efficient frontier, and it allows for the determination of portfolio mixes that provide an optimal return for the least amount of risk.

Modern portfolio theory (MPT), or mean-variance analysis, is a mathematical framework for assembling a portfolio of assets such that the expected return is maximized for a given level of risk. It is a formalization and extension of diversification in investing, the idea that owning different kinds of financial assets is less risky than owning only one type. Its key insight is that an asset's risk and return should not be assessed by itself, but by how it contributes to a portfolio's overall risk and return. It uses the variance of asset prices as a proxy for risk. Read more

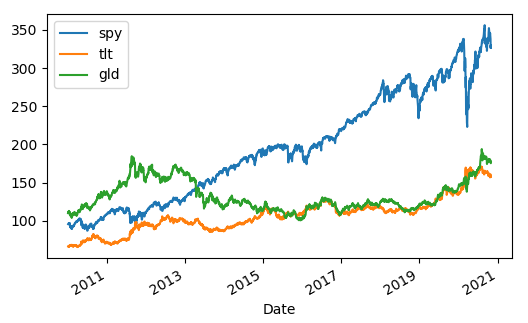
In this post, we are going to provide a concrete example of implementing MPT in Python. Our portfolio consists of 3 Exchange Traded Funds (ETF): SPY, TLT, and GLD which track the S&P500, long-term Treasury bond, and gold respectively.  We downloaded 10 years of data from Yahoo Finance. The picture below shows the price time series of the 3 ETFs.

Modern Portfolio Theory in Python

We utilized Python to calculate each EFT expected return and volatility. We then assigned a random weight to each ETF and determined the portfolio’s expected return and volatility. Recall that,

MPT assumes that investors are risk averse, meaning that given two portfolios that offer the same expected return, investors will prefer the less risky one. Thus, an investor will take on increased risk only if compensated by higher expected returns. Conversely, an investor who wants higher expected returns must accept more risk. The exact trade-off will not be the same for all investors. Different investors will evaluate the trade-off differently based on individual risk aversion characteristics. The implication is that a rational investor will not invest in a portfolio if a second portfolio exists with a more favorable risk-expected return profile – i.e., if for that level of risk an alternative portfolio exists that has better expected returns.

Under the model:

  • Portfolio return is the proportion-weighted combination of the constituent assets' returns.
  • Portfolio volatility is a function of the correlations ρij of the component assets, for all asset pairs (i, j).

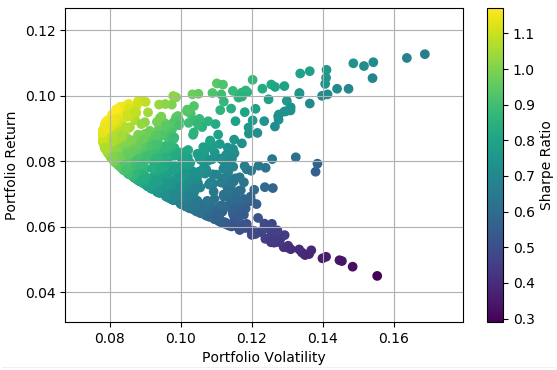
We repeated the above process many times and obtained the following return/risk profile for possible portfolios.

Portfolio Management in Python

In the next installment, we will search for an optimal portfolio that provides the highest return for the least amount of risk.

Click on the link below to download the Python program.

Article Source Here: Modern Portfolio Theory-Portfolio Management in Python


Saturday, November 28, 2020

Statistical Analysis of an ETF Pair-Quantitative Trading In Python

Pair trading, or statistical arbitrage, is one of the oldest forms of quantitative trading. In this post, we are going to present some relevant statistical tests for analyzing the Australia/Canada pair. We chose this pair because these countries’ economies are tied strongly to the commodity sector, therefore they share similar characteristics and could be a good candidate for pair trading.

We first downloaded the data from Yahoo Finance. We downloaded 10 years of data of EWA and EWC, which are the Exchange Traded Funds (ETF) associated with Australia and Canada, respectively.  We then utilized Python to plot the data and perform statistical tests.

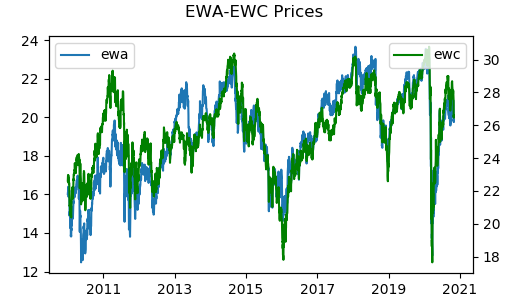
The chart below shows the price time series. Visually, these 2 country ETFs move in a similar fashion, more or less.

Quantitative Trading In Python

We next calculated the correlation of returns and obtained 0.7908. The high correlation makes the pair a good candidate for statistical arbitrage.

We then determined the price spread and performed the Augmented Dicker Fuller test for cointegration.

In statistics and econometrics, an augmented Dickey–Fuller test (ADF) tests the null hypothesis that a unit root is present in a time series sample. The alternative hypothesis is different depending on which version of the test is used, but is usually stationarity or trend-stationarity. It is an augmented version of the Dickey–Fuller test for a larger and more complicated set of time series models.

The augmented Dickey–Fuller (ADF) statistic, used in the test, is a negative number. The more negative it is, the stronger the rejection of the hypothesis that there is a unit root at some level of confidence. Read more

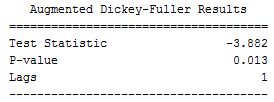
The picture below shows the test results. The p-value is less than 0.05; therefore the pair is cointegrated at the 95% confidence level.

cointegration test in python

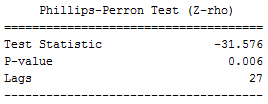
Finally, we performed the Phillips-Perron test for cointegration on the spread.

In statistics, the Phillips–Perron test (named after Peter C. B. Phillips and Pierre Perron) is a unit root test. That is, it is used in time series analysis to test the null hypothesis that a time series is integrated of order 1... Like the augmented Dickey–Fuller test, the Phillips–Perron test addresses the issue that the process generating data for yt might have a higher order of autocorrelation than is admitted in the test equation—making yt-1 endogenous and thus invalidating the Dickey–Fuller t-test. Read more

The picture below shows the test results. The p-value is less than 0.05; therefore the pair is cointegrated at the 95% confidence level.

cointegration analysis in python

In the next installment, we will implement a trading strategy using this cointegrated pair.


Click on the link below to download the Python program.

Article Source Here: Statistical Analysis of an ETF Pair-Quantitative Trading In Python


Tuesday, November 24, 2020

Capital Asset Pricing Model

The Capital Asset Pricing Model (CAPM) is a model that investors use to determine the rate of return of an investment. The model describes the relationship between the expected return of an investment and its risks. Furthermore, CAPM is one of the most commonly used models in finance for pricing risky stocks. Both investors and businesses use the model to calculate their rate of return.

For investors, CAPM can help with the calculation of the required rate of return. More importantly, it can help them develop a diversified portfolio of investments. For companies and businesses, CAPM helps with the calculation of the cost of equity. They can use the cost of equity in different processes such as investment appraisal or in the calculation of Weighted Average Cost of Capital (WACC).

Capital Asset Pricing Formula

To calculate the rate of return using CAPM investors and businesses use the following formula.

E(r)i = Rf + βi (E(r)m - Rf)

In the above formula, ‘E(r)i’ represents the expected rate of return of an investment or stock. ‘Rf' signifies the risk-free rate of return prevalent in the market. 'βi’ represents the beta of the investment. Finally, ‘E(r)m' denotes the average rate of return in the market. Together, (E(r)m - Rf) represents the market risk premium.

Risk-free rate of return

The risk-free rate of return is the rate of return of a risk-free investment. Usually, it represents a theoretical rate of return and is close to the rate of return of short-term government treasury bills. For most calculations, investors can use the rate of return on those treasury bills instead of calculating the risk-free rate of return.

Beta

The most important part of the CAPM model is the Beta factor or coefficient of an investment. Beta represents the systematic risk of an investment. Systematic risk is the risk that applies to the market as a whole and not to a specific company or stock. Usually, companies with a beta of above 1 are riskier than the market. A beta of lower than 1 represents a lower risk than the market.

Market risk premium

The market risk premium of an investment represents the premium above the risk-free rate of return in the market. It is calculated by deducting the risk-free rate of return from the average market rate of return. In simpler words, the market risk premium is the difference between the average market rate of return and the risk-free rate of return.

Advantages of using CAPM

There are many advantages to using CAPM. First of all, it is easy to use. All the figures required in its calculations are available in the market. Similarly, the model is also useful because it takes into account the systematic risk of investments or stocks. Through these, CAPM allows investors to diversify their portfolio and eliminate unsystematic risk.

Disadvantages of using CAPM

There are also some disadvantages to using CAPM. These disadvantages come from the assumptions made by the model or its dependencies. First of all, CAPM assumes there is a risk-free rate of return, which is not possible. Similarly, for some investments calculating beta may not be possible. Therefore, it may limit the model.

Conclusion

The Capital Asset Pricing model can help investors determine the required rate of return of an investment. It is useful for both investors and businesses. To calculate the rate of return, investors must use the CAPM formula given above.

Article Source Here: Capital Asset Pricing Model


Sunday, November 22, 2020

Formula for Dividend Yield

The dividend yield is a financial ratio that represents the annual dividends paid to shareholders against a stock in relation to its current market price. In simpler words, the dividend yield measures a company's dividends as a percentage of its stocks' current market price.

The dividend yield is a useful formula for investors and shareholders to determine how much dividends they can expect in the future. As the ratio is different for various industries and companies, it plays a critical part in the decision-making process of investors and shareholders. Usually, stable or mature companies will have better dividend yields as compared to startups.

Dividend yield formula

The formula for dividend yield is straightforward. Investors can use the formula below to calculate it.

Dividend yield = Annual dividends per share / Market value per share

In the above formula, the annual dividends per share represent the total dividends paid out by the company divided by its number of outstanding shares. Similarly, the market value per share represents the share price of the company at the time of evaluation.

Example

A company, Banana Co. paid total dividends of $10,000 in its last accounting period. Its total outstanding number of shares at the time was 5,000 shares. The current market price of Banana Co.'s share in the stock market is $100. Therefore, its dividend yield will be.

Dividend yield = Annual dividends per share / Market value per share

Dividend yield = ($10,000 / 5,000) / $100

Dividend yield = 0.02 or 2%

Meaning of dividend yield

The dividend yield, as stated above, shows the percentage of the market value of a share paid in dividends. Therefore, the higher the dividend yield of a stock is, the better it is. For example, a company that has a dividend yield of 10% is preferable to investors as compared to companies that pay below that. However, it does not only stop there.

Some companies may have fluctuations in their dividend yields over time. Usually, if a company's dividend yields increase each year, it means the company has been growing. However, it may also imply that the company's share prices are dropping in the market. Similarly, declining dividend yields also do not mean decreasing dividends. Therefore, investors need to be aware of the causes behind the fluctuations.

Importance of dividend yield

The dividend yield is a vital ratio for dividend investors. Investors that rely on steady dividends may base their investing decisions on the dividends paid by the company. Therefore, the dividend yield is critical in their decision-making process. For growth investors, however, dividend yield may not be as important.

Limitations of dividend yield

The dividend yield, as a financial metric, may have some limitations. As mentioned above, while higher dividend yields are preferable, they are not necessarily an indicator of higher dividends. Similarly, the dividend yield may not be an indicator of a better performance of the company. Usually, paying high dividends means the company is not investing in future activities, which can worsen the future prospects of investments.

Conclusion

The dividend yield is a metric used to calculate the percentage of dividends of a company over its current market price. Usually, investors prefer a higher dividend yield stock. However, there may be some other issues they must consider as well.

Originally Published Here: Formula for Dividend Yield


Saturday, November 21, 2020

Arbitrage Pricing Theory

The Arbitrage Pricing Theory (APT) is a model that describes the relationship between the expected returns from an asset and its risks. Often used as an alternative to the Capital Asset Pricing Model (CAPM), APT is a multi-factor model for investments that explains the risk-return relationship using various independent factors rather than relying on a single index, as with CAPM.

While this model got developed in 1976, much after CAPM, however, many investors still use the latter for their calculations. As compared to CAPM, the APT uses less restrictive assumptions, which gives it an advantage over CAPM. While the APT uses a multi-index approach to calculations, it does not specify what the index should be, which is its downside compared to CAPM, which does.

Arbitrage Pricing Theory Formula

The formula to calculate the expected return using APT depends on how many factors or indexes investors take into account. Therefore, it can be represented as follows.

E(r)i = Rf + β1RP1 + β2RP2 + β3RP3 + … + βnRPn

In the above formula, “E(r)i” represents the return calculated by the model. “Rf” denotes the risk-free rate of return. “βx” symbolizes the beta for a specific index or factor considered. “RPx" represents the risk premium of the considered index. Finally, "n" denotes the number of indexes considered by the investor.

There are two types of factors that the model considers. These include macroeconomic factors, such as inflation, GDP, etc., and factors specific to the market or stock. The market-specific risks consist of systematic risks associated with the stock in question.

Assumptions of Arbitrage Pricing Theory

There are three assumptions that APT makes when calculating return on an asset. First of all, it assumes that returns depend only on systematic factors. Similarly, the model assumes that no-arbitrage exists. In case there are any arbitrage opportunities, the market will exploit them. Lastly, APT implies that investors can build a portfolio of diversified assets, thus, eliminating any specific risks in the process.

Advantages of using Arbitrage Pricing Theory

There are many advantages of using APT to determine the expected return. First of all, APT allows investors to use several factors rather than be limited to one. The model also does not specify the factors, allowing investors the choice to weigh in factors of their choice.

Similarly, it has fewer restrictions as compared to some other models. Likewise, the model also provides much better compensation for unforeseen circumstances. Lastly, the model provides investors with an opportunity to identify and exploit arbitrage opportunities.

Disadvantages of using Arbitrage Pricing Theory

Despite its advantages, APT may also come with some disadvantages. First of all, some investors may consider APT more complicated as compared to other models. Similarly, APT requires risk sources to be accurate to produce accurate results. Despite all the calculations, however, the model still does not guarantee results.

Conclusion

Arbitrage Pricing Theory (APT) is a model used in the calculation of the return of investments. It is considered an alternative to the well-known Capital Asset Pricing Model (CAPM). However, unlike CAPM, APT weighs multiple factors or indexes when calculating an expected return.

Originally Published Here: Arbitrage Pricing Theory