Friday, November 20, 2020

P/E Ratio of Stocks

The price-to-earnings (P/E) ratio represents the relationship between the market value of the stock of a company and its earnings per share (EPS). It is one of the most commonly used and well-known ratios used by investors in valuing the stocks of a company. Other names for the P/E ratio are the price multiple or earnings multiple.

P/E ratio formula

The formula to calculate the P/E ratio is straightforward and is as follows.

P/E ratio = Market price of stock / Earnings Per Share

The market price of the stock shows its current price in the stock market. Usually, this market price of a stock is readily available from the stock market. The Earnings Per Share (EPS) represent the total earnings of a company divided by its total shares in the last accounting period. The EPS of a company is available in its financial statements, usually in the Income Statement.

Example

A company named Red Co. has a current market stock price of $100. In the previous accounting period, Red Co. had total earnings of $100 million while its outstanding shares in the market were 20 million shares. Therefore, the company's EPS was $5 per share ($100 million/20 million shares). The P/E ratio of Red Co. is as follows.

P/E ratio = Market price of stock / Earnings Per Share

P/E ratio = $100 / $5

P/E ratio = 20 (times)

Meaning of P/E ratio

When investors use the P/E ratio to evaluate their investments, they must understand what it means. A high P/E ratio signifies that the market trusts the company will grow in the future. Therefore, the market participants are willing to pay higher for the company's stocks despite the low EPS. However, investing in high P/E ratio stocks also presents higher risks as the growth potential may not capitalize.

Similarly, a low P/E ratio means that the stock of a company is undervalued. These usually represent value stocks in which investors may want to invest. Usually, the reason behind a low P/E is mispricing and can result in outstanding gains once it recovers to its correct value in the market. It may also indicate a company is doing well compared to its past trends.

It is crucial to use the P/E ratio as a comparison tool to make better use of it. P/E ratio cannot give a meaningful result on its own. Therefore, investors must obtain the P/E ratio for different stocks and compare them. Based on their risk preferences, investors can then make decisions in which stock they want to invest. Similarly, it is better to use the P/E ratio to compare between similar stocks, for example, companies within the same industry, for best results.

Limitations of P/E ratio

The P/E ratio has some limitations. First of all, the ratio requires investors to determine the price or EPS of a stock, which may not be possible for every company. For example, for private companies, the information may not be readily available. Similarly, some companies may have volatile market stock prices, which can affect the calculations. The ratio also fails to consider the earning growth of stocks.

Conclusion

P/E, or price-to-earnings ratio, represents the price of a stock in relation to the EPS of the company to which it relates. It is one of the most favourite tools used by investors when making decisions about their investments.

Originally Published Here: P/E Ratio of Stocks


Thursday, November 12, 2020

What It Takes to Win at Quantitative Investing

A recent podcast on Bloomberg offers some interesting perspectives on quantitative investing.

Interest in quantitative investing strategies continues to grow; however, as the space gets more competitive, making money and winning gets harder and harder. Computation costs alone can be prohibitive. On the latest episode, we speak with Columbia Business School professor Ciamac Moallemi about how the world's best quant funds thrive.

quantitative trading

The key takeaways are,

  • Quantitative investing has two key characteristics. The first characteristic is that the investment process is entirely systematic. The second characteristic is that quantitative strategies are active investment strategies.
  • The market is inefficiently efficient, or efficiently inefficient, meaning that there exist inefficiencies, but it's a competitive game, and there are lots of smart people with a lot of resources out there who are going after these inefficiencies, and when they identify them and trade on them, the inefficiencies will disappear.
  • The key to winning in quantitative investing is not about identifying some flaws in the market or some inefficiencies or some opportunities to make money. It's about having a team and a process to keep finding those over and over again.
  • Historically, much of quantitative investing has been built on what was called “technical models”, where basically you're using historical price and trade data to forecast future price movements. What we have seen emerge over the past 10 years is a shift towards alternative data.
  • Quantitative investors operate quite differently than research groups in big tech places. Research conducted in laboratories of big tech companies like Google, Microsoft, or Bell is not that different than in an academic institution. The main output is publication in research journals and conference papers. In the quant world, the research process is, however, much more applied, and there is no incentive for publishing research results.
  • What value does quantitative investing actually create for society? Quantitative investing is about arbitraging the small inefficiencies, so maybe it will make prices slightly more efficient. But is that worth the enormous infrastructure investment being spent on it?

Originally Published Here: What It Takes to Win at Quantitative Investing

Monday, November 2, 2020

Enterprise Value to EBITDA Multiple

Introduction

The Enterprise Value to EBITDA ratio, also known as the EBITDA multiple, is a ratio used to measure the value of a company. Usually, the reason for calculating the EV/EBITDA ratio is to use it as a comparison tool between different companies. It can also be helpful in other techniques, such as Comparable Company Analysis. The multiple has two components, Enterprise Value and EBITDA.

Enterprise Value (EV) is a measure of the total value of a company. EV is the sum of the current market capitalization of a company, its debt, minority interest, and preferred shares, less its cash and cash equivalents. On the other hand, EBITDA represents the earnings of a company before considering its interest, taxes, depreciation, and amortization.

Uses of Enterprise Value to EBITDA Multiple

As mentioned above, the EV/EBITDA multiple can help in comparing the value of different companies. This ratio can help investors determine how many times the EBITDA of a company they have to pay if they want to acquire the company. It can also help in the calculation of the terminal value in the Discounted Cash Flow (DCF) model. Finally, it can also help in calculating a target price for a company in an equity research report.

Advantages of Enterprise Value to EBITDA Multiple

There are many advantages of using EV/EBITDA multiple. First of all, it is easy to calculate and the information required to calculate it is readily available. Secondly, as mentioned above, it can help provide a comparison between the values of different companies. Most experts also prefer the EV/EBITDA ratio as compared to other metrics such as the Price to Earnings ratio. Finally, the multiple works great for valuing a well-established business with low capital expenditures.

Disadvantages of Enterprise Value to EBITDA Multiple

The EV/EBITDA multiple may also have some disadvantages. First of all, it does not take into account the assets or capital expenditures of a company. It is also not a good proxy for cash flow due to its use of the EBITDA. It is also hard to adjust for companies with different growth rates. The ratio is also susceptible to manipulation due to its use of EBITDA.

Example

A company has an Enterprise Value of $300 million and an EBITDA of $30 million. It can calculate its EV/EBITDA multiple in the following way.

EV/EBITDA multiple = Enterprise Value / EBITDA

EV/EBITDA multiple = $300 million / $30 million

EV/EBITDA multiple = 10 times

In this example, the EV and EBITDA are already available. However, practically, these figures are not available beforehand and need to be calculated. For instance, if investors want to calculate the multiple, they must obtain the current market capitalization, debt, minority interest, and value of preferred shares of a company. After that, they need to deduct cash and cash equivalents from the sum of those amounts. Similarly, they must add the interest, taxes, depreciation, and amortization of the company to its earnings to obtain its EBITDA.

Conclusion

The EV/EBITDA multiple is a ratio calculated by dividing the Enterprise Value (EV) of a company by its EBITDA. It has different uses, including being used to calculate the value of a company and as a comparison tool. There are many advantages of using the multiple. However, it may have its disadvantages as well.

Originally Published Here: Enterprise Value to EBITDA Multiple

Sunday, November 1, 2020

Comparative Company Analysis

Introduction

Comparative Company Analysis (CCA) is a process used to compare two similar companies, operating in the same industry. It is a valuation methodology that allows users to evaluate the ratios of similar public companies and use those ratios to derive the value of another company. CCA assists users in determining the relative value of a company. It is different from other methods that allow users to determine the intrinsic value of a company, such as Discounted Cash Flow analysis.

How to perform Comparative Company Analysis?

Performing CCA is simple and straightforward. First of all, users need to analyze different companies and obtain those that are suitable for comparison. This process needs them to perform some research and also requires some judgment on their part. When trying to find companies for comparison, users should consider companies that are in the same industry and geographical location. Usually, CCA works best for companies that are competitors.

Once the user selects different companies to use in CCA, the next step is to obtain their financial statements and other financial information. For public listed companies, these are available in their relevant stock markets or their websites. For private listed companies, the financial statements may be difficult to obtain. Usually, private listed companies also have their financial statements on their websites. However, for some others, they may not be available at all.

Once the user obtains the required financial information of the selected companies, the process of comparative analysis begins. Users can use different metrics to compare those companies. These metrics include share price, market capitalization, Enterprise Value (EV), revenues, net profits, EBITDA, EPS, etc. Similarly, users can also calculate different ratios for companies. These ratios may include EV/EBITDA, EV/Revenue, Price to Earnings, Price to Book value, etc. There are online templates available that users can also use as a base for CCA.

Finally, users can interpret the information from the CCA to make decisions regarding the company in question. Usually, the interpretation and decision depend on the needs of the users. There are no specific rules regarding how they should interpret the information. CCA can only help users analyze quantitative information. Therefore, users must understand that the results obtained through CCA will not consider qualitative factors.

Advantages of Comparable Company Analysis

Comparable Company Analysis can help users determine a benchmark value-based on the firm valuation. It provides them with a tool to compare and assess the financial performance of different companies better. The information obtained through CCA relates to real market data. Therefore, it is better than other tools that depend on estimations and forecasts. Furthermore, CCA is easy to calculate and explain, making it a superb tool for users of all levels.

Disadvantages of Comparable Company Analysis

The main disadvantage of CCA is that it requires many different companies for the best results. If there are a few comparable companies, the tool may not provide accurate results. Similarly, which companies qualify for comparison depends on the users’ judgment. Furthermore, there are no companies that one may consider truly comparable.

Conclusion

Comparable Company Analysis is a tool that allows users to compare similar companies in the same industry. For CCA, users need to select similar companies first and obtain financial information about them, including their financial statements. Then they can use different metrics and ratios to compare these companies. The interpretation of these comparisons depends on the needs of the users. CCA may have some advantages and disadvantages, given above.

Originally Published Here: Comparative Company Analysis

Saturday, October 31, 2020

Forecasting Implied Volatility with ARIMA Model-Volatility Analysis in Python

In a previous post, we presented theory and a practical example of calculating implied volatility for a given stock option. In this post, we are going to implement a model for forecasting the implied volatility. Specifically, we are going to use the Autoregressive Integrated Moving Average (ARIMA) model to forecast the volatility index, VIX.

In statistics and econometrics, and in particular in time series analysis, an autoregressive integrated moving average (ARIMA) model is a generalization of an autoregressive moving average (ARMA) model. Both of these models are fitted to time series data either to better understand the data or to predict future points in the series (forecasting). ARIMA models are applied in some cases where data show evidence of non-stationarity, where an initial differencing step (corresponding to the "integrated" part of the model) can be applied one or more times to eliminate the non-stationarity.

The AR part of ARIMA indicates that the evolving variable of interest is regressed on its own lagged (i.e., prior) values. The MA part indicates that the regression error is actually a linear combination of error terms whose values occurred contemporaneously and at various times in the past. The I (for "integrated") indicates that the data values have been replaced with the difference between their values and the previous values (and this differencing process may have been performed more than once). The purpose of each of these features is to make the model fit the data as well as possible. Read more

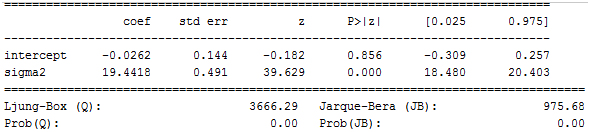
It is shown in Reference [1] that the implied volatility index can be modeled and forecasted using the ARIMA model. To apply the ARIMA model to the VIX index, we first downloaded 5 years of historical data of the VIX from Yahoo Finance. Next, we used the first 4 years of data as the training set and fit the data to the ARIMA model. The Python SARIMA program returned the following model parameters,

Implied volatility analysis in python

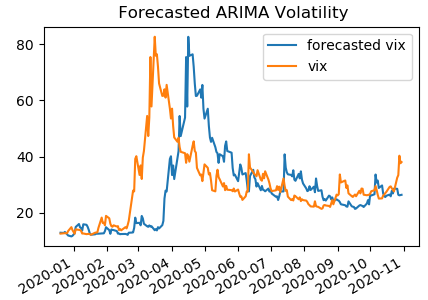
After obtaining the parameters, we applied the model to the remaining 1 year of data and calculated the forecasted VIX on a rolling window of 1 month. The picture below shows the rolling forecasted VIX along with the VIX index,

Volatility trading in python with ARIMA

Click on the link below to download the Python program.

References

[1]  K. Ahoniemi,  Modeling and forecasting implied volatility, Helsinki School of Economics, 2009.

Post Source Here: Forecasting Implied Volatility with ARIMA Model-Volatility Analysis in Python

Friday, October 30, 2020

FASB Proposes Scope Clarification for Reference Rate Relief

On July 27, 2017 the Financial Conduct Authority, the U.K.'s top regulator, tasked with overseeing Libor, announced the benchmark will be phased out by 2021. Alternative risk-free rates are being set up for the different currencies. For the US Dollar, the US Fed's Alternative Reference Rates Committee (ARRC) has recommended using the Secured Overnight Financing Rate (SOFR), which has been published since April 2019.[86] For the British Pound, it is the Sterling Over Night Index Average (SONIA), and for the Euro, the Euro Short-Term Rate (€STR).Regulators are now expecting financial institutions to actively prepare for the cessation of LIBOR and the adoption of alternative risk-free rates. The FCA and Prudential Regulation Authority (PRA) were the first regulators globally to ask firms for their preparation and actions to manage the LIBOR transition, in a September 2018 letter. Other regulators, including the European Central Bank's supervisory board, followed. ISDA has run several consultations to improve the fallback process. Read more

FASB issued a proposal Thursday that is intended to clarify the scope of the board’s guidance on reference rate reform.

In March, FASB issued Accounting Standards Update No. 2020-04, Reference Rate Reform (Topic 848): Facilitation of the Effects of Reference Rate Reform on Financial Reporting. The standard was issued to address accounting challenges resulting from the sunsetting of the London Interbank Offered Rate (LIBOR) as well other benchmark interest rates banks use to make short-term loans to one another.

FASB ASC Topic 848 provides temporary, optional expedients and exceptions for using GAAP to contract modifications and hedging relationships that reference LIBOR or another reference rate that is expected to be discontinued. Read more

Post Source Here: FASB Proposes Scope Clarification for Reference Rate Relief

Thursday, October 29, 2020

Discounted Cash Flow Model

Introduction

The Discounted Cash Flow (DCF) model is a method that investors use to estimate the value of an investment based on future cash flows. The DCF model uses the forecasted cash flows of investment to determine its value today. However, this tool isn't only for investors. Business owners and company shareholders can also use the DCF model to make decisions related to their existing companies in businesses.

The DCF model depends on a concept known as the time value of money. That's what the 'discounted' part of its name means. According to the time value of money concept, cash flows generated today are worth more than those generated in the future. Therefore, it requires users to discount cash flows using a rate of return, or cost of capital, for better decision-making.

Uses of Discounted Cash Flow Model

As mentioned above, there are many uses of the discounted cash flow model. Firstly, investors can use it to estimate the present value of an investment, which allows them to make better decisions. Companies may also use it to evaluate different projects and compare them with each other. The DCF model helps companies estimate the actual value of an investment, taking into consideration the time value of value, rather than its perceived value.

Some examples of how different entities can use the DCF model include determining the value of a company or a project. It may also include determining the value of the shares, bonds, and other instruments of a company. In short, the DCF model can be used to estimate the intrinsic value of any project or investment that generates cash flows.

Disadvantages of Discounted Cash Flow Model

The DCF model can also have some disadvantages. The model requires users to make different estimates. These estimates include forecasting cash flows of an investment or project, or the rate of return to use. Estimating these amounts is not as straightforward as they depend on certain internal and external factors. Therefore, a misestimation in these values can change the outcome of the decisions made by an entity.

Discount Cash Flow Model formula

The formula to calculate the cash flows of a particular instrument, investment, or project using the DCF model is straightforward. It involves discounting all the cash flows using an appropriate rate of return or cost of capital. Usually, calculating the present value of cash flows using the DCF model requires a proper structure, using a spreadsheet program. However, the formula can be presented as below.

DCF = [CF­­1 x (1+r)-1] + [CF2 x (1+r)-2] + … + [CFn x (1+r)-n]

In the above formula ‘CF’ represents the cash flow for each year. ‘r’ represents the required rate of return or cost of capital of a particular project or investment. Lastly, ‘n’ represents the total number of years of the project.

Example

A company wants to assess a 5-year particular project. The cost of capital of the company is 10%. The estimated cash flows from the project are as below.

Year

Cash flow

1

       150,000

2

       120,000

3

       100,000

4

         60,000

5

         50,000

       480,000

Using the DCF model, the company can calculate the present value of all cash flows using the 10% cost of capital. The calculation is as below.

Year Cash flow Discount factor (10%) Present value
1        150,000 0.909   136,350
2        120,000 0.826     99,120
3        100,000 0.751     75,100
4          60,000 0.683     40,980
5          50,000 0.621     31,050
       480,000   382,600

Conclusion

The Discounted Cash Flow (DCF) model is a tool used to calculate the present values of the cash flows from a particular project or investment. Investors, shareholders, and companies use the model to determine the value of a particular investment or project. However, the model works with assumptions, which may affect the calculations.

Originally Published Here: Discounted Cash Flow Model

Wednesday, October 28, 2020

EBITDA, What It Is and How to Calculate It

Introduction

EBITDA, short for Earnings Before Interest, Taxes, Depreciation, and Amortization, is an indicator of the financial performance of a company. It is an alternative to the traditional measures of a company's performance, such as operating profits. Similarly, it is also considered an alternative for the operational cash flows of a company. EBITDA is one of the many variations of the EBIT metric.

Importance of EBITDA

EBITDA is a crucial metric for investors and businesses. The metric gives investors a quick estimate of the value of a specific company. Besides, companies that suffer in converting revenues into profits can still have a positive EBITDA. That is because EBITDA considers the earnings of a company before considering items that are outside its control. Therefore, investors can use EBITDA to determine whether the losses made by a company related to operating deficiencies or other factors.

Similarly, EBITDA is also vital because it allows investors to compare between different companies in a better way. However, they can only use it to compare similar companies operating in the same industry. Furthermore, it can also allow companies to compare their performance against competitors and other similar companies to identify any problems within their processes.

Problems with EBITDA

Using EBITDA can also have some problems. Firstly, EBITDA is not an officially recognized metric by any accounting standard. Similarly, some experts believe that taking out depreciation from EBITDA disregards the lost value of assets over time. Therefore, it can produce inaccurate results, especially for companies that acquire many assets over time through the use of debt instruments.

How to calculate EBITDA?

The calculation of EBITDA is straightforward. The formula to calculate EBITDA is below.

EBITDA = Earnings + Interest + Taxes + Depreciation + Amortization

The figures required in calculating EBITDA are available in the financial statements of a company. The earnings, interest, and tax amounts are available in the Statement of Profit or Loss of companies. The figures for depreciation and amortization are obtainable from the Notes to the Financial Statements.

There’s also an alternative formula to calculate EBITDA, given below.

EBITDA = Operating profit + Depreciation + Amortization

The operating profit of a company is its profit before interest and taxes, also referred to as EBIT, available in its Statement of Profit or Loss.

Example

A company has earnings of $100 million. It charged interest expense of $7 million, taxes amounting to $3 million, depreciation of $10 million, and amortization of $5 million in its financial statements. To calculate its EBITDA, the company can use the following formula.

EBITDA = Earnings + Interest + Taxes + Depreciation + Amortization

EBITDA = $100 million + $7 million + $3 million + $10 million + $5 million

EBITDA = $125 million

Conclusion

EBITDA is a metric widely used as an indicator of the financial performance of a company. EBITDA stands for Earnings Before Interest, Taxes, Depreciation, and Amortization. There are many different uses of EBITDA, although it may come with some problems. There are two formulas used in the calculation of the EBITDA of a company.

Originally Published Here: EBITDA, What It Is and How to Calculate It

Tuesday, October 27, 2020

Preferred Shares vs Common Shares

Introduction

When it comes to the shares of companies, there are two commonly available types in the market. These include common shares and preferred shares. While they both give shareholders certain rights, there are some differences between them. Therefore, it is crucial to understand the differences between them.

What are Common Shares?

Common shares sometimes referred to as ordinary shares, are the most commonly traded shares of companies. Usually, when people talk about the shares of a company, they refer to common shares. Most companies around the world only issue ordinary shares. Common shares give shareholders partial ownership of a company. It also comes with certain voting rights, which allows common shareholders to choose the board of directors of a company.

Apart from voting rights, common shareholders also get the right to receive dividends. Dividends are the distribution of the profits of a company to its shareholders. Some companies may not distribute dividends at all. However, most others do pay their shareholders regular dividends, usually at the end of each accounting period.

However, dividends aren't the only type of return that common shareholders get. Common shareholders can also benefit from an increase in the price of the shares of a company, which can result in capital gains for them. Capital gains happen with the market price of the shares of a company exceed the price paid by the shareholders originally.

Finally, common shares also give rights to the assets of a company in case of liquidation. However, there are some conditions attached to the assets they can receive. For example, in the case of liquidation, a company must pay all its debts first. After the repayment of these debts, if the company has any assets remaining, it is distributed to its shareholders.

What are Preferred Shares?

Preferred shares are different from common shares due to many reasons. Companies issue preferred shares less frequently as compared to common shares. Furthermore, preferred shares give the shareholder a preference over ordinary shareholders. However, they do not come with voting rights, unlike common shares. Therefore, preference shareholders cannot take part in selecting the board of directors of a company.

When it comes to dividends, preferred shares come with an advantage. Usually, preference shareholders receive a higher dividend as compared to common shareholders. Similarly, the dividend that companies pay to their preferred shareholders is predetermined, unlike common shares. When paying dividends, companies must pay preferred shareholders first and any remaining amount to common shareholders.

While preferred shares can still generate a capital gain for shareholders, they do not appreciate in value as much as common shares. Therefore, preferred shareholders don’t usually rely on capital gains but mostly buy preferred shares for dividends. The market price and capital gain on preferred shares also depend on how close they are to maturity.

Finally, in case a company liquidates, preferred shareholders get an advantage over ordinary shareholders. As mentioned above, companies must pay their debts first when liquidated. However, after paying these debts, they must first compensate their preferred shareholders. Any remaining amount after they pay off their debts and preferred shareholders are attributable to common shareholders.

Valuing Preferred Shares

The valuation of preferred shares is different from the valuation of common shares. Preferred shares can be valued using the same valuation method as convertible and/or callable bonds.

Conclusion

Common or ordinary shares are shares that give partial ownership of the company to shareholders. On the other hand, preferred shares are also similar but come with a preference over common shares. Both of them are different due to many reasons. These include differences in voting rights, dividends, capital gains, and preference at liquidation.

Post Source Here: Preferred Shares vs Common Shares

Monday, October 26, 2020

Forecasting Volatility with GARCH Model-Volatility Analysis in Python

In a previous post, we presented an example of volatility analysis using Close-to-Close historical volatility. In this post, we are going to use the Generalized Autoregressive Conditional Heteroskedasticity (GARCH) model to forecast volatility.

In econometrics, the autoregressive conditional heteroscedasticity (ARCH) model is a statistical model for time series data that describes the variance of the current error term or innovation as a function of the actual sizes of the previous time periods' error terms; often the variance is related to the squares of the previous innovations. The ARCH model is appropriate when the error variance in a time series follows an autoregressive (AR) model; if an autoregressive moving average (ARMA) model is assumed for the error variance, the model is a generalized autoregressive conditional heteroskedasticity (GARCH) model.

ARCH models are commonly employed in modeling financial time series that exhibit time-varying volatility and volatility clustering, i.e. periods of swings interspersed with periods of relative calm. ARCH-type models are sometimes considered to be in the family of stochastic volatility models, although this is strictly incorrect since at time t the volatility is completely pre-determined (deterministic) given previous values.  Read more

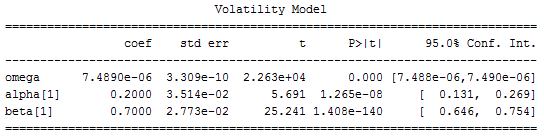
As an example, we are going to apply the GARCH model to the SP500. We first downloaded 5 years of historical data of SPY from Yahoo Finance. Next, we used the first 4 years of data as the training set and fit the data to the GARCH (1, 1) model. The Python ARCH program returned the following model parameters,

GARCH volatility model in python

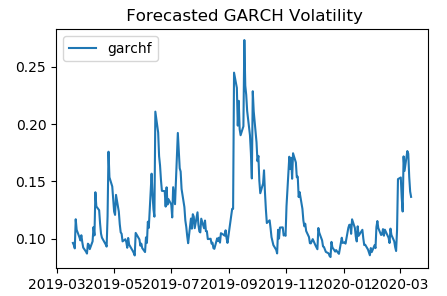
After obtaining the parameters, we applied the model to the remaining 1 year of data and calculated the forecasted volatility on a rolling window of 1 month. The picture below shows the rolling forecasted volatility,

GARCH volatility trading in python

Click on the link below to download the Python program.

Post Source Here: Forecasting Volatility with GARCH Model-Volatility Analysis in Python