Friday, June 30, 2017

Using a Market Timing Rule to Size an Option Position, A Static Case

In the previous installment, we discussed the use of a popular asset allocation/market timing rule (10M SMA rule hereafter) to size a short option position. The strategy did not work well as it was the case in traditional asset allocation. We thought that the poor performance was due to the fact that the 10M SMA rule is more of a market direction indicator that is not directly related to the PnL driver of a delta hedged position.

Recall that an option position can be loosely divided into 2 categories:  dynamic and static [1]

1-Dynamic:  the option position is delta hedged dynamically; its PnL driver is the implied/realized volatility dynamics. The profit and loss at the option expiration depends on the volatility dynamics, but not on the terminal value of the spot price.

2-Static: the option position is left unhedged; the payoff of the strategy depends on the spot price at option expiration but not on the volatility dynamics, i.e. it’s path independent.

In this post, we will apply the 10M SMA rule to a static, unhedged position. All other parameters and rules are the same as in our previous post. Briefly, the trading rules are as follows

1-NoTiming: Sell 1-Month at-the-money (ATM) put option, no rehedge.

2-10M-SMA: we only sell an ATM put option if the closing price of the underlying is greater than its 10M SMA.

Our rationale for investigating this case is that because the payoff of a static, unhedged position depends largely on the direction of the market, the 10M SMA timing rule will have a higher chance of success.

Table below summarizes and compares results of the short put strategy with and without the application of the 10M SMA rule

Strategy NoTiming 10M-SMA
Number of Trades: 115 81
Percent Winners: 0.77 0.77
Average P&L: 65.69 62.77
Largest losing trade -2702.50 -1601.00
Largest winning trade 652.00 451.50
Profit Factor (W/L): 1.47 1.54
Worst drawdown -5002.50 -1897.00


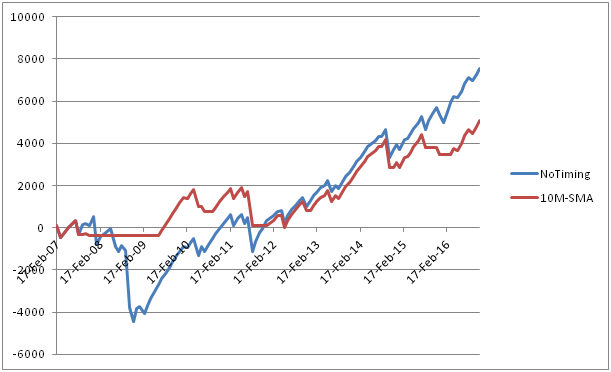
Graph below shows the equity curves of the 2 strategies
options trading strategies using market timing

As we can see from the Table and Graph, the 10M SMA rule performed better in this case. Although the win percentage and average PnL per trade remained approximately the same, the risks have been reduced significantly. The largest loss was reduced from $2.7K to $1.6K; drawdown decreased from $5K to $1.9K. As a result, the profit factor increased from 1.47 to 1.54.

In conclusion, the 10M SMA rule performs well in the case of a static, unhedged short put position. Using this rule, the risk-adjusted return of the trade was enhanced significantly.


Other related studies:

  • While researching the literature on this subject, I came across a similar study presented by E. Sinclair [2]. He showed that, for a delta hedged short strangle position, market timing based on the VIX index improved the results significantly. Since the VIX is a measure of volatility, its good performance is consistent with our understanding that for a delta hedged position, we should use a market timing indicator based on volatility and not on direction.
  • Pavel Bambásek also published similar studies recently. He used 200-Days SMA to time the market: http://www.bluetrader.cz/delta-hedging-ano-ne/


References

[1]  N.N. Taleb, Dynamic Hedging: Managing Vanilla and Exotic Options, Wiley, 1997

[2] E. Sinclair, Volatility Trading, Wiley, 2nd edition, 2013

Original Post Here: Using a Market Timing Rule to Size an Option Position, A Static Case

Sunday, June 25, 2017

Oil Producers Stop Hedging, Who’s Right?

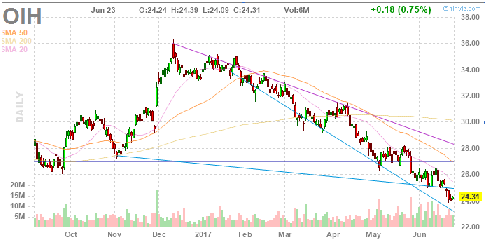
Last week, Bloomberg reported that due to the low oil price, some producers refused to lock in a loss, and thus stopped hedging.

Oil producers have scaled back locking in future prices “considerably” since February, Societe Generale SA said in a report, citing a shift in options pricing driven by consumer companies like shippers and airlines. Late last year, sellers including U.S. shale drillers locked in prices in droves when benchmarks rose after OPEC announced plans to cut production.

“This is a significant shift in the relative producer-consumer hedging behavior,” wrote David Schenck, a cross-commodity strategist at Societe Generale. “While consumers may try to lock in low prices, most producers will simply refuse to lock-in loss-making prices.”

Brent’s 12-month put skew closed at its lowest level since May 2016 on Monday. This indicator tends to rise when producers of oil are locking in their supply and fall when consumers, including shippers and airlines, hedge their output. The second-month equivalent was at its lowest level since December 2015. WTI skews have also fallen sharply since OPEC’s last meeting on May 25. Crude in New York touched $42.75 a barrel on Tuesday, the lowest level since Nov. 14, and was closing in on a bear market. Read more

oil hedging
Oil service ETF as at June 23, 2017. Source: finviz.com

On the other hand, we recall that Mexico just started its famous oil hedging program by buying put options

Mexico has taken the first step in its annual oil hedging program, asking Wall Street banks for price quotes on the put options it buys to lock in prices for the following year, according to people familiar with the matter.

The put options give Mexico the right, but not the obligation, to sell oil at a predetermined price and time. The hedge runs from December to November. Read more

So who’s right?

We note that the Mexican hedgers have had a good track record

The Latin American country has received handsome payouts from its oil hedging program, earning a record $6.4 billion in 2015 after OPEC embarked on a war for market share that sent prices tumbling. Mexico made $5 billion in 2009, after the global financial crisis, and another $2.7 billion in 2016.

Since the modern oil hedge program started in 2001, Mexico has made a profit of $2.4 billion — its hedges raked in $14.1 billion in gains and paid out $11.7 billion in fees to banks and brokers. The country also made money in the 1990s, when the hedge wasn’t done on an annual basis.

ByMarketNews

Saturday, June 24, 2017

VIX Options: Should We Buy Them When Volatility is Low?

In the continuation of the “Low Volatility is Not a New Normal” theme, Adam Samson of Financial Times published another post based on the recent report by JPMorgam which suggested using VIX options for managing the risks.

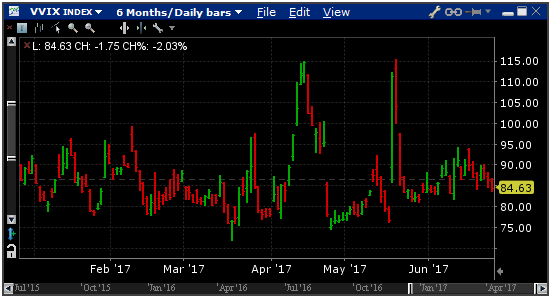
Risk assets, like stocks, have been rallying “for years”, sending market volatility near “record lows... While fundamentally volatility should not be high, it is clear to us that the current macro environment does not warrant all-time low volatility either.

[caption id="attachment_361" align="aligncenter" width="551"]VIX options volatility VVIX VVIX as at June 23, 2017. Source: Interactivebrokers[/caption]
The article concluded with a suggestion made by the JPM strategist.

For US equities, Mr Kolanovic suggests buying out-of-the-money call options on the Vix. The derivatives that are currently “close to their cheapest level over the last five years” would gain in value if the Vix rose over a pre-determined period and pay-out if the index hits a certain “strike” price. The same strategy can be used for the VSTOXX index, which provides a similar measure of implied volatility for the Euro Stoxx 50 that tracks eurozone blue chips. Read more

We believe that this suggestion is sound. However, it’s important to note that

  • Just buying volatility when the VIX is low will not produce positive returns in a long run. But, if you have a large exposure to the US equity and want to buy VIX options as a hedge, then this is a sensible strategy. (If you have exposure to European markets, then VSTOXX futures and options are good alternatives).
  • Buying volatility when it is low and rising will produce better returns.
  • Before buying VIX options as a hedge, one should ask the questions: are they less expensive than SPX puts? Why do we buy VIX calls instead of SPX puts?

These questions should be addressed if we want to increase the efficiency of our hedging or trading strategy.

Post Source Here: VIX Options: Should We Buy Them When Volatility is Low?

Monday, June 19, 2017

Mark Cuban Created Volatility Derivatives

Last week, the Wall Street Journal reported a story about a retail day trader who made money by shorting the volatility index. It also recounted how the volatility index was created and how it became a popular tool for investors and speculators.

It’s interesting to read that Mark Cuban was one of the earliest investors in the VIX. No, he did not conceive the index, and in the end the deal did not go through, but at least he created a demand for VIX derivatives. For the full story, click here


Mark Cuban and the volatility index
Image credit: Brian Solis

In the northern summer of 2002, newly minted billionaire Mark Cuban called Goldman Sachs looking for a way to protect his fortune from a crash. Because the VIX typically rises when stocks fall, he wanted to use it as ­insurance.

Devesh Shah, the Goldman trader who fielded the call, says he instead offered him an arcane derivative called a “variance swap,” but Cuban wasn’t interested.

Lamenting the lost opportunity, Shah met up with Sandy Rattray, a Goldman colleague and erstwhile indexing buff with a knack for packaging investment products. What if, the pair speculated, they could tap the VIX brand and reformulate the index based on their esoteric swaps? Turning the VIX into something tradeable was nothing more than a math problem, says Rattray.

The pair rewrote the VIX ­formula, expanding it to a larger universe of stockmarket bets and making it possible to create a tradeable futures contract. Their equation synthesises thousands of trades and distils them all into a single number meant to represent the collective expectations for the market.

Shah and Rattray handed their invention to CBOE, the owner of the VIX trademark. The formula allowed the CBOE to cash in its marquee index. The exchange launched VIX futures in 2004, and VIX options two years later. The firm billed VIX trading as a new risk-management tool. Trading grew steadily, but slowly.

Then the financial crisis hit, serving up a huge marketing opportunity — more than $US5 trillion was erased from the S&P500, the only thing rising in the US was the VIX. Who wouldn’t pay just a little bit more to protect their nest egg from the wipeout?

At Barclays, a farsighted few realised access was a big problem. Trading futures and options was too complicated and costly for many investors. The bank instead devised a product that tracks VIX contracts but trades on an exchange just like any a corporate stock. Suddenly anyone with a brokerage account could trade like the pros.

The Barclays iPath S&P500 VIX Short-Term Futures ETN launched in January 2009, just months before the S&P500 hit a 12-year low.

VIX trading exploded. Terrified investors piled into Barclays’s new product and similar ones that followed, desperate for anything that might help them repair their dented fortunes. “I think of it as the great democratisation of volatility,” says Bill Speth, vice-president of research and product development at CBOE.

So is trading the VIX a dangerous game?

The article ended with a quote from Bill Luby “If you knew the landscape, there was a lot of money to be made.”

ByMarketNews

Saturday, June 17, 2017

Low Volatility is Not a New Normal

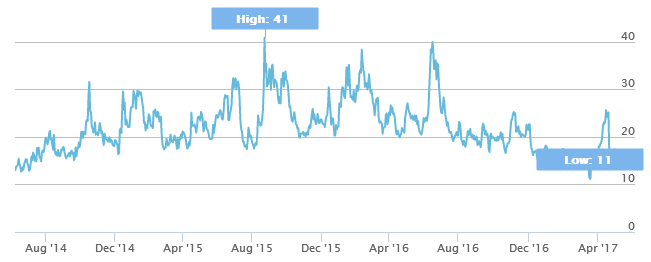
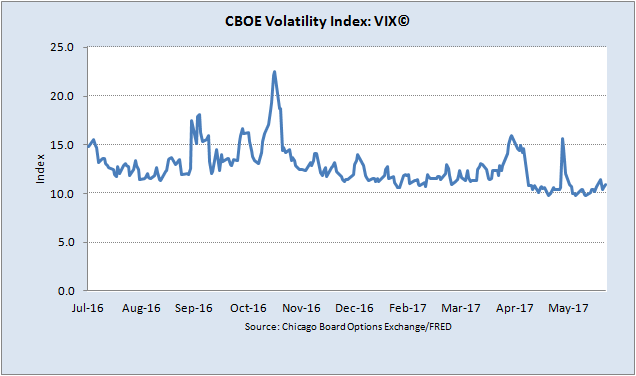
Last week, JPMorgan issued a report on the state of quantitative investing and the current low volatility environment. The report pointed out that despite the political uncertainties (Comey testimony, UK elections, ECB, geopolitical uncertainty, Qatar etc.), the volatility remains subdued. In fact, in the last 20 years the VIX closed lower than 10 for a total of 11 days, and 7 of those days were in the past month.

Low volatility in the market VIX as at June 16, 2017

The report also provided some explanations as why the VIX is so low:
  • Belief that the macro environment is very benign
  • Macro decorrelation: low correlations (driven by quant flows, sector and thematic trading) are temporarily reducing volatility by 2-4 points
  • Massive supply of volatility through yield generation products and strategies. It is estimated that supply from yield seeking risk premia strategies grew by ~$1Bn vega (~30% of the S&P 500" options market)
  • Low realized volatility resulting in a low implied volatility
Read more
None of the reasons above is surprising, and they are consistent with arguments presented in the post entitled Why is Volatility so Low?
What we find interesting is that retail traders keep shorting the VIX in this low volatility environment
[A] Boca Raton, Florida, day trader says he has made $USUS53,000 since the start of the year by effectively shorting the CBOE Volatility Index, nicknamed the VIX. That includes a white-knuckle day on May 17, when the VIX spiked 46 per cent following reports that President Donald Trump had pressured former FBI Director James Comey to drop an investigation into former national ­security advisor Michael Flynn. Read more
However, we rarely hear about investors who lost most of their money when the volatility exploded.
Article Source Here: Low Volatility is Not a New Normal

Monday, June 12, 2017

Economic Hedging is Not a Trivial Task

 Last week, Bloomberg reported that Mexico has started executing its famous oil hedging program

Mexico has taken the first step in its annual oil hedging program, asking Wall Street banks for price quotes on the put options it buys to lock in prices for the following year, according to people familiar with the matter.

The Mexican oil hedge, which typically covers between 200 million and 300 million barrels, has the potential to roil the market as the banks writing the put options for the country’s ministry of finance hedge themselves in the market by selling oil and refined products futures and swaps.

The report also said that the Mexican hedgers are very good at hedging their oil production

Since the modern oil hedge program started in 2001, Mexico has made a profit of $2.4 billion — its hedges raked in $14.1 billion in gains and paid out $11.7 billion in fees to banks and brokers. The country also made money in the 1990s, when the hedge wasn’t done on an annual basis. Read more

However, not all producers know how to hedge

Despite Mexico’s hedging success, few other commodity-rich countries have followed suit. Ecuador hedged oil sales in 1993, but losses triggered a political storm and the nation never tried again. More recently, oil importers Morocco, Jamaica and Uruguay have bought protection against rising energy prices, but their deals had been relatively small.

Last month, Reuters reported that Iraq may consider hedging its crude oil production. However, the country’s producers are still not sure how to execute the hedge.

Iraq may look at hedging part of its crude oil production, the head of the OPEC member’s oil marketer SOMO said, as a way to protect government revenue against the risk of oil price volatility.

It is not clear what type of hedging might be considered by SOMO. Some organisations, such as Mexican oil monopoly Pemex, seek to ensure oil is sold at a guaranteed fixed price throughout the year, while others, such as Shell and BP, hedge their sales against short term oil price volatility.

“There are a lot of requirements that should be taken first: we need to study hedging carefully and train people, we need to know the best companies involved in hedging … we still don’t understand the hedging process completely,” Al Amri said, adding there was no certainty that Iraq would adopt hedging practices. Read more

So after all, hedging is not trivial!


ByMarketNews

Wednesday, June 7, 2017

VSTOXX European Volatility Exchange Traded Products: EVIX and EXIV

With the popularity of Exchange Traded Funds on the rise and an exponential increase in short interests in the volatility ETFs, it’s just a question of time that ETF issuers will launch new instruments aiming at the volatility markets in other geographical locations. Indeed, last month, VelocityShares issued 2 new volatility ETFs that allow investors to gain exposure to volatility in the European markets, i.e. the VSTOXX index.

[caption id="attachment_337" align="aligncenter" width="651"]VSTOXX Volatility Index Exchange Traded Fund VSTOXX Volatility Index as at June 7, 2017. Source: stoxx.com[/caption]

...  Janus rolled out the VelocityShares 1X Long VSTOXX Futures ETN (BATS: EVIX), which is linked to the VSTOXX Short-Term Futures Investable Index USD, and the VelocityShares 1X Daily Inverse VSTOXX Futures ETN (BATS: EXIV), which is linked to the VSTOXX Short-Term Futures Inverse Investable Index USD. Both EVIX and EXIV come with a 1.35% expense ratio.

EVIX and EVIX reflect indices based on VSTOXX Short-term Futures, a widely observed measure of European equity market volatility, similar to what the VIX or CBOE Volatility Index does based on U.S. equity market volatility.

Specifically, the VSTOXX Short-Term Futures Investable Index tries to reflect the performance of a long position in a portfolio of VSTOXX futures to provide exposure to constant-maturity one-month forward, one-month implied volatilities on the underlying EURO STOXX 50 Index. Due to its long exposure to VSTOXX futures, the EVIX will likely increase in value when the volatility of European equities rises and more likely decrase in value when volatility of European equities diminishes.

Meanwhile, the VSTOXX Short-Term Futures Inverse Investable Index tries to reflect the performance of a short or inverse position in a portfolio of VSTOXX futures designed to provide exposure to constant-maturity one-month forward, one-month implied volatilities on the same underlying index. Due to its short exposure to VSTOXX futures, EXIV is likely to rise in value when volatility of European equities dissipates and likely to dip in value when volatility in European equities increases. Read more

So the US investors now can have easy access to European volatility market. And it would be interesting to see how the new ETF issuance will affect the volatility futures and spot prices in Europe.

In the mean time, we performed a quick study by calculating the same statistics that we presented in the post entitled Is Volatility of Volatility Increasing.  The table below gives the dates and changes in the volatility index when the daily STOXX returns were between -2.5% and -1.5%, and the VSTOXX index experienced an increase of 18% or greater. The data is from 2003 to the present.

Date Vol change
22-Sep-03 20.41%
17-Nov-03 18.92%
22-Mar-04 22.09%
15-Apr-05 25.72%
30-May-06 18.16%
08-Oct-08 19.65%
07-May-10 34.72%
17-Jul-14 19.15%
17-Apr-15 24.60%
21-Aug-15 18.49%
17-May-17 19.23%

It’s interesting to note that the volatility spikes in European spot volatility index happened less frequently and less violently as compared to the US counterpart.

Last and not least, Sumit Roy presented some interesting observations when comparing the European volatility index and futures to their US counterparts:

  • VSTOXX Systematically Higher Than VIX: A lot of that has to do with the fact that the underlying stock index for VSTOXX has only 50 components compared with 500 for the VIX
  • The contango is lower the difference between front-month futures and subsequent contracts―is generally lower for VSTOXX compared with VIX. Read more


Article Source Here: VSTOXX European Volatility Exchange Traded Products: EVIX and EXIV

Sunday, June 4, 2017

Volatility Trading Strategies

Volatility trading strategies were tested on VXX, but they can be used on other VIX ETFs.

Below is a summary of entry and exit rules


The spreadsheet below presents the statistics for the trading strategies


The documents below provide detailed description of the strategies and a comparative analysis

Originally published here